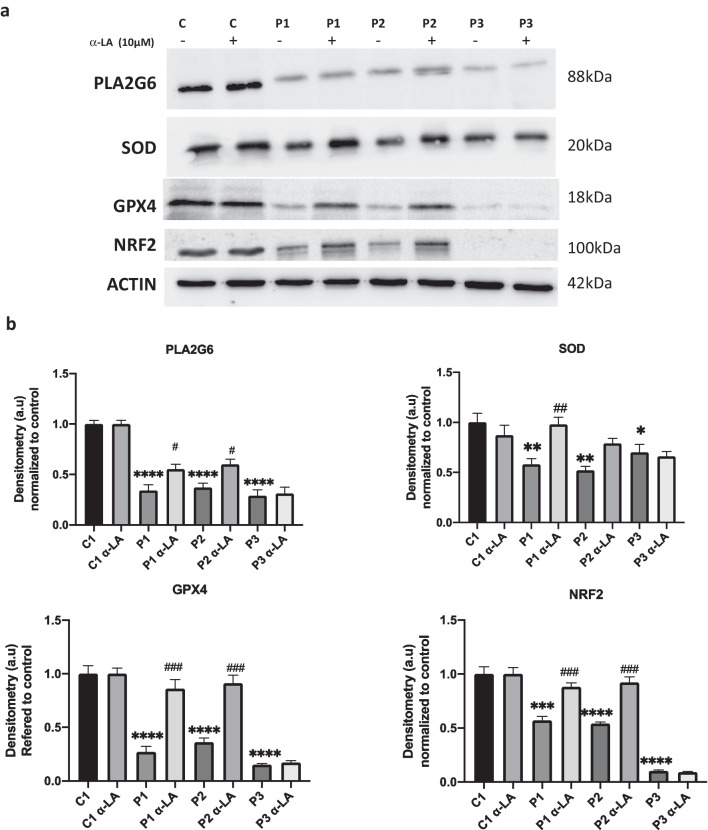
Fig. 12.
Effect of α-LA on antioxidant protein expression levels. Control and PKAN fibroblasts (P1, P2, P3) were treated with α-LA at 10 μM for 20 days a Expression levels of PLA2G6, SOD, GPX4 and NRF2 in treated and untreated control and PKAN cells. Actin was used as loading control. b Densitometry of the Western blotting. Data represent the mean ± SD of three separate experiments. **p < 0.01, ***p < 0.005, ****p < 0.0001 between PKAN patients and controls. #p < 0.05, ##p < 0.01, ###p < 0.005 between untreated and treated fibroblasts. A.U., arbitrary units

