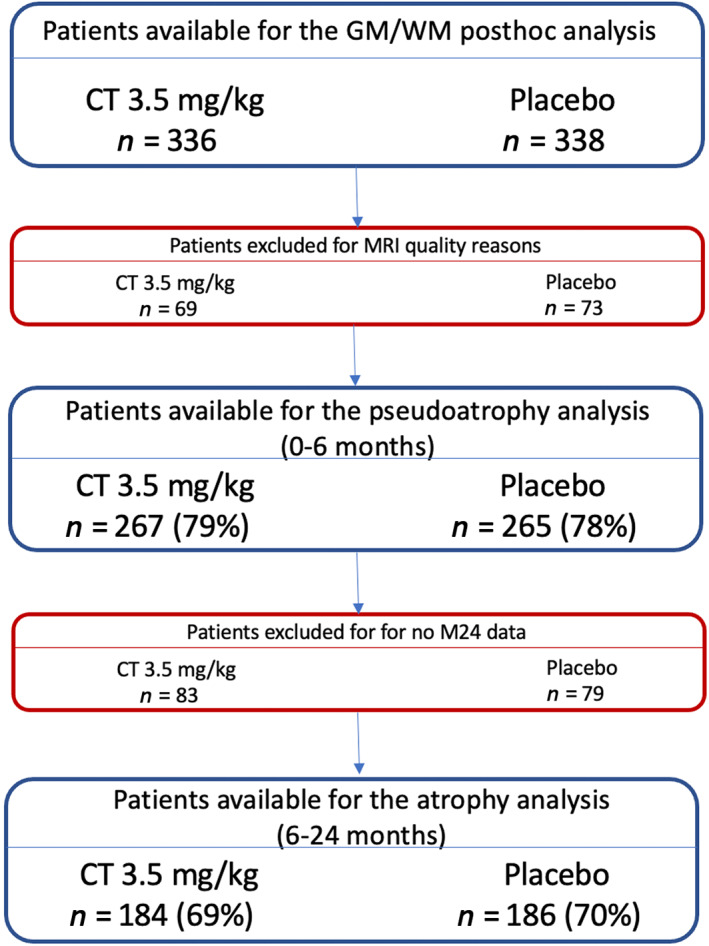
FIGURE 2.

Flow diagram describing patient selection for the MRI analysis. Number of patients and the percentage of the cohort available for the analysis in the previous time interval are shown. Abbreviations: CT, cladribine tablets; GM, grey matter; M, Month; WM, white matter
