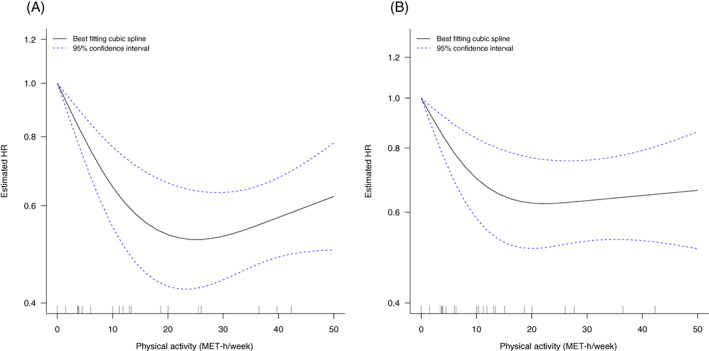
FIGURE 3.

Nonlinear association between recreational physical activity after diagnosis and (A) all‐cause mortality and (B) breast cancer‐specific mortality. The curves show the nonlinear dose–response associations between recreational physical activity after diagnosis and (A) all‐cause mortality and (B) breast cancer‐specific mortality, estimated using restricted cubic spline regression with three knots at 10th, 50th and 90th percentiles of distribution of the exposure and pooled with random‐effects meta‐analysis. Recreational physical activity at 0 metabolic equivalent of task (MET) was chosen as reference.
