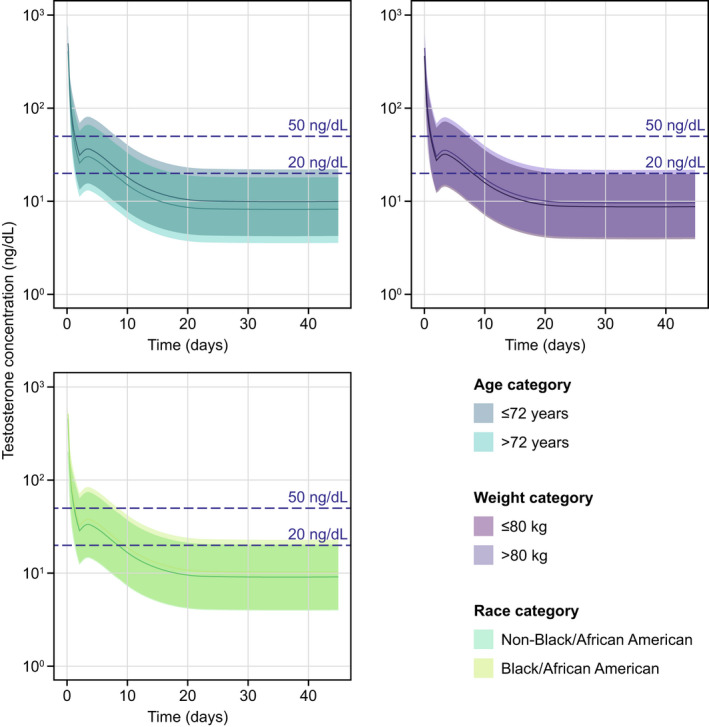
Figure 4.

Simulation of testosterone profiles by covariate subgroups according to age, weight, and race. The shaded areas represent the 90% prediction interval (5th to 95th percentile) of the simulations. The solid lines represent the median of the simulations. Relugolix was simulated to be administered for 45 days with 100% adherence. Testosterone concentrations of < 50 ng/dL and < 20 ng/dL represent the castration levels and profound castration levels, respectively.
