
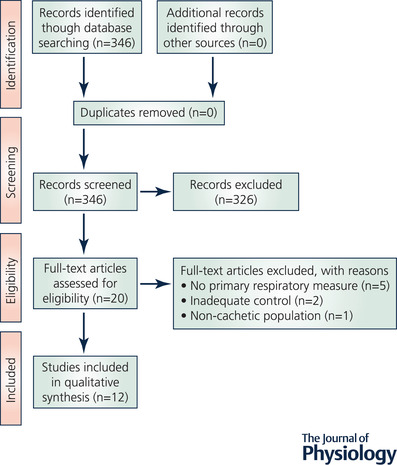
Figure D1. PRISMA flow diagram illustrating the number of papers excluded at each stage of the screening process (Moher et al., 2009).
Official websites use .gov
A
.gov website belongs to an official
government organization in the United States.
Secure .gov websites use HTTPS
A lock (
) or https:// means you've safely
connected to the .gov website. Share sensitive
information only on official, secure websites.