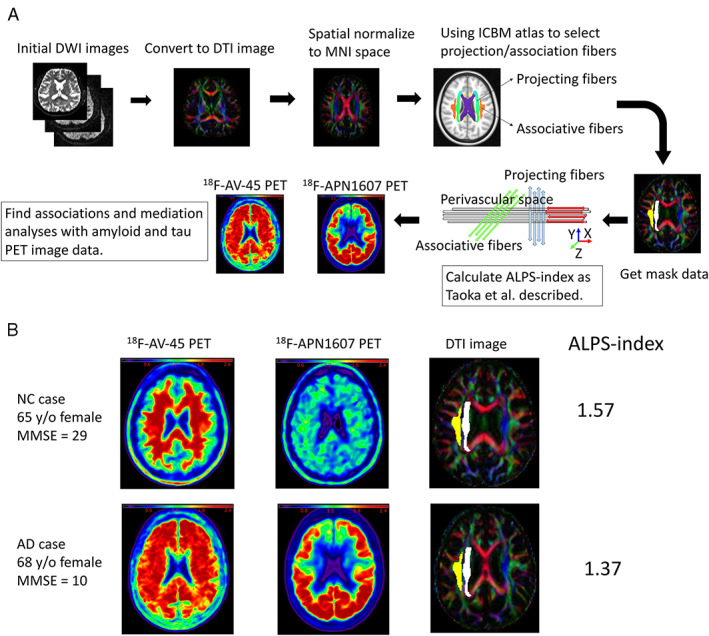
FIGURE 1.

Schema shows the analysis process and data from two representative participants. (A) Analysis process from initial diffusion‐weighted imaging (DWI) images to calculate analysis along the perivascular space (ALPS) indexes and evaluate the associations with standardized uptake value ratios of amyloid (18F‐AV‐45) position emission tomography (PET) images and tau (18F‐APN 1607) PET images. (B) Images and data from 2 representative participants show the 18F‐AV‐45 PET images, 18F‐APN 1607 PET images, diffusion tensor imaging (DTI) images, and ALPS‐indexes. AD = Alzheimer disease; ICBM = International Consortium of Brain Mapping; MMSE = Mini‐Mental State Examination; MNI = Montreal Neurological Institute; NC = normal control; y/o = years old.
