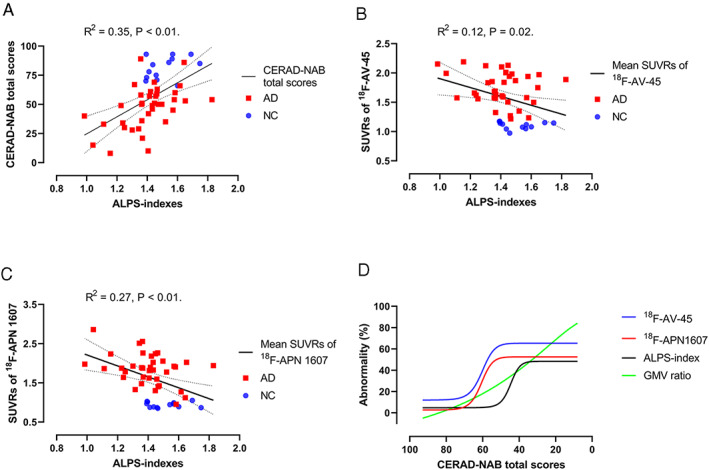
FIGURE 2.

Diffusion tensor image analysis along the perivascular space (ALPS) indexes are correlated with the mean standardized uptake value ratios (SUVRs) of 18F‐AV‐45 PET images and 18F‐APN 1607 position emission tomography (PET) images and Consortium to Establish a Registry for Alzheimer's Disease Neuropsychological Assessment Battery (CERAD‐NAB) total scores. (A) ALPS‐indexes showed a significant correlation with CERAD‐NAB total scores after adjusting for age, sex, years of education, and APOE4 genotype (R 2 = 0.35, p < 0.01). (B) ALPS‐indexes showed a significant correlation with the mean SUVRs of 18F‐AV‐45 PET images after adjusting for age, sex, years of education, and APOE4 genotype (R 2 = 0.12, p = 0.02). (C) ALPS‐indexes showed a significant correlation with the mean SUVRs of 18F‐APN 1607 PET images after adjusting for age, sex, years of education, and APOE4 genotype (R 2 = 0.27, p < 0.01). Dotted lines indicate the 95% confidence intervals. (D) Combined fitting curves from the SUVRs of the 18F‐AV‐45 PET image, SUVRs of the 18F‐APN1607 PET image, ALPS‐indexes, and gray matter volume (GMV) ratios in the precuneus region. The values of regional SUVRs in the 18F‐AV‐45 PET images and 18F‐APN1607 PET images were scaled to 0–100%, with 0% representing the minimal value and 100% representing the maximal value. The original ALPS‐indexes and regional GM ratios were reversed, with 100% representing the minimal value and 0% representing the maximal value. This normalization procedure made the higher values of abnormalities in regional SUVRs, GMV ratios, and ALPS‐indexes represent the more severe disease state. AD = Alzheimer disease; NC = normal control.
