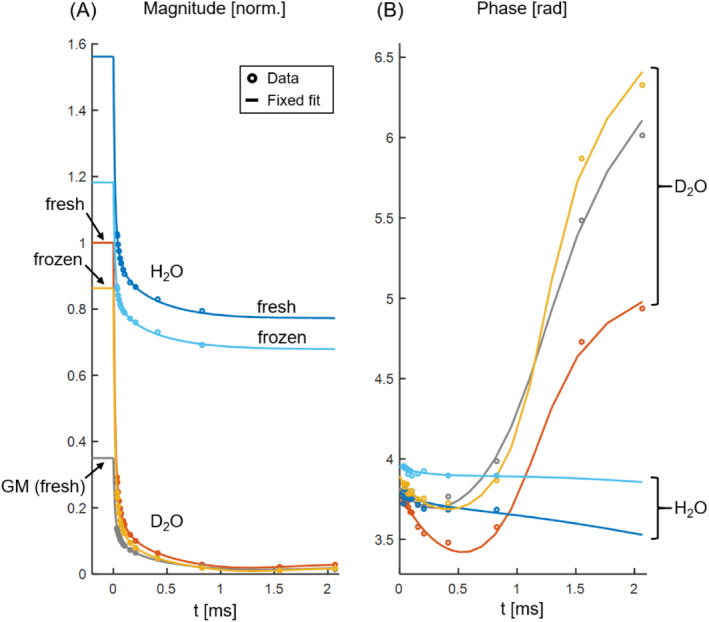
FIGURE 2.

Magnitude (A) and phase (B) of the SPI data and associated fixed fits for the samples from tissue block 1. Data points represent an average over large WM regions unless specified as GM data. The magnitudes are normalized by the fit magnitude at time zero in WM for the fresh D2O sample. H2O and D2O samples are clearly distinguishable in both plots. In the absence of a dominant water pool, the phase curves exhibit a characteristic shape; in contrast, the phase of the H2O data is approximately linear and, because the local resonance offset has been corrected for, relatively flat. Frozen samples have reduced magnitude with respect to their fresh counterparts but otherwise exhibit similar signal behavior. The GM region has significantly lower magnitude than the WM region from the same sample, but the general signal behavior of the two tissue types is comparable
