Figure 4.

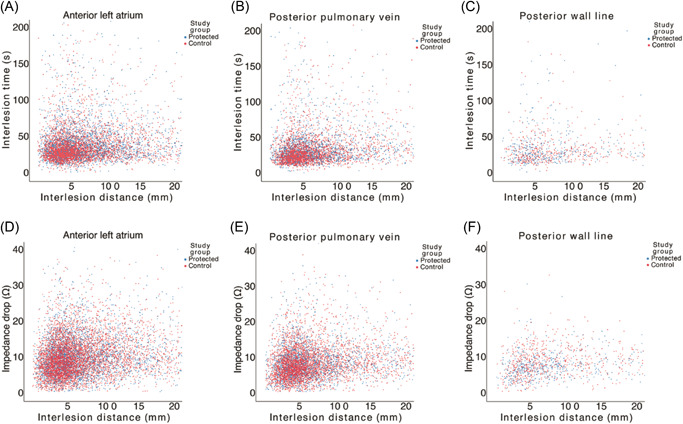
Scatter plots showing the relationships between interlesion distance and interlesion time (A–C), and interlesion distance and impedance drop (D–F) in the protected and control groups in each location.

Scatter plots showing the relationships between interlesion distance and interlesion time (A–C), and interlesion distance and impedance drop (D–F) in the protected and control groups in each location.