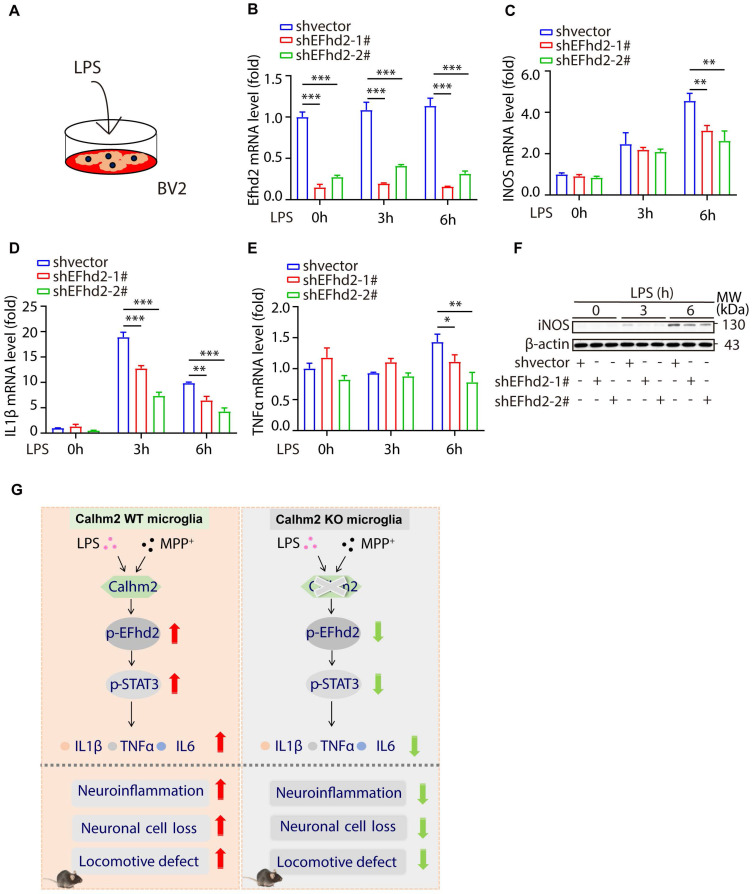
Figure 7.
Knockdown of EFhd2 significantly inhibits LPS-induced inflammation levels in BV2 cells. (A) Diagram of the experimental model. (B-E) Quantitative PCR of expression of EFhd2, iNOS, TNFα and IL-1β in control and knockdown EFhd2 cells after LPS stimulation at different time points; statistical results are shown as mean ± S.E.M, *P < 0.05, **P < 0.01, ***P < 0.001. (F) Expression of iNOS and EFhd2 in control and knockdown EFhd2 cells was measured by immunoblotting after LPS stimulation at different time points, using anti-β-actin as a loading control. (G) The working model of microglial Calhm2 in PD mouse model.

