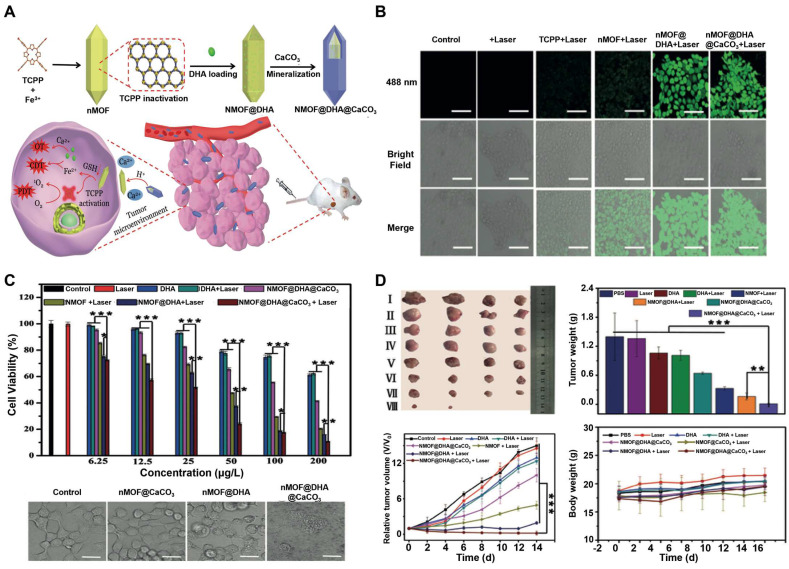
Figure 11.
(A) Schematic illustration of the preparation of the nanoplatform and the programmed drug release for cancer therapy. (B) Confocal fluorescence imaging of 4T1 cells treated under different conditions to evaluate ROS production based on DCFH-DA fluorescence intensity. The nanoparticles were incubated with 4T1 cells for 4 h, then DCFH-DA probes were incubated for 20 min with 4T1 cells before irradiation. Scale bars are 100 mm. (C) in vitro therapy effect. (a) MTT assay of 4T1 cells with different treatments at different concentrations. (b) Morphology of 4T1 cells with different treatments. Scale bars are 25 mm. (*P < 0.05, **P<0.01, ***P<0.001). (D) in vivo anticancer effect. a) Picture of tumors dissected on the 14th day after different treatments (I: PBS, II: Laser, III: DHA, IV: DHA + Laser, V: NMOF@DHA@CaCO3, VI: NMOF + Laser, VII: NMOF@DHA + Laser, and VIII: NMOF@DHA@CaCO3 + Laser). b) Average tumor weights in different treatment groups. c) Tumor growth curve after the mice received different treatments. d) Body-weight changes within 14 days during treatment. (*P < 0.05, **P < 0.01, ***P < 0.001). Reproduced with permission 210. Copyright 2019, Wiley-VCH.

