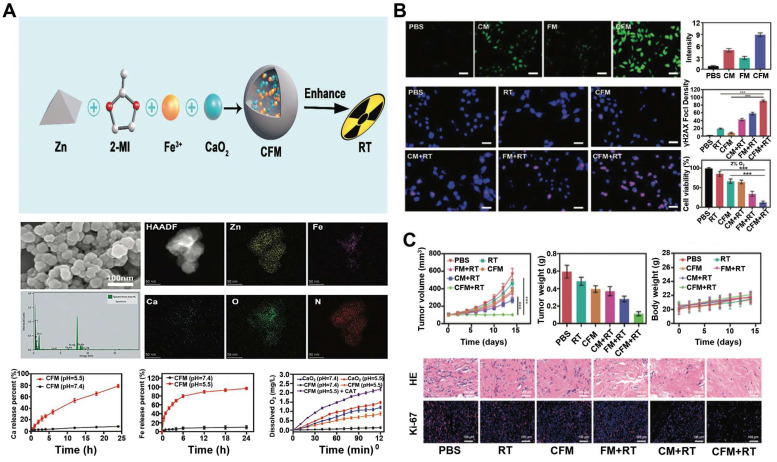
Figure 5.
(A) Schematic illustration of CFM supplying intratumoral H2O2 and O2 for enhanced chemodynamic therapy and radiotherapy. SEM images of CFM; EDS mapping of CFM after washing with distilled water; Ca2+ and Fe3+ release in buffer solutions with different pH values; oxygen generation under a range of experimental conditions was evaluated using a dissolved oxygen meter. (B) Assessment of the in vitro efficacy of CFM. DCFH-DA was visualized and quantified in tumor cells treated as indicated. Scale bars = 20 μm. Representative images of DNA fragmentation and nuclear condensation within tumor cells following the indicated treatments, with DAPI and g-H2AX being used to visualize nuclei and DNA fragmentation, respectively. Scale bars: 50 μm. Quantitative assessment of γ-H2AX foci density (γ-H2AX foci/100 /μm2) for >100 cells per treatment condition. Following control, RT, CFM, FM + RT, CM + RT, and CFM + RT treatment, an MTT assay was used to assess 4T1 tumor cell survival under 2% O2 conditions (n = 5). *P < 0.05, **P < 0.01, ***P < 0.005; Student's t-test. (C) Tumor volume and body weight curves in mice bearing Representative H&E and Ki-67 stained sections from mice treated as indicated. Data are means ± SD (n = 5). *P < 0.01, **P < 0.005, ***P < 0.001; Student's t-test. Reproduced with permission 125. Copyright 2020, The Royal Society of Chemistry.

