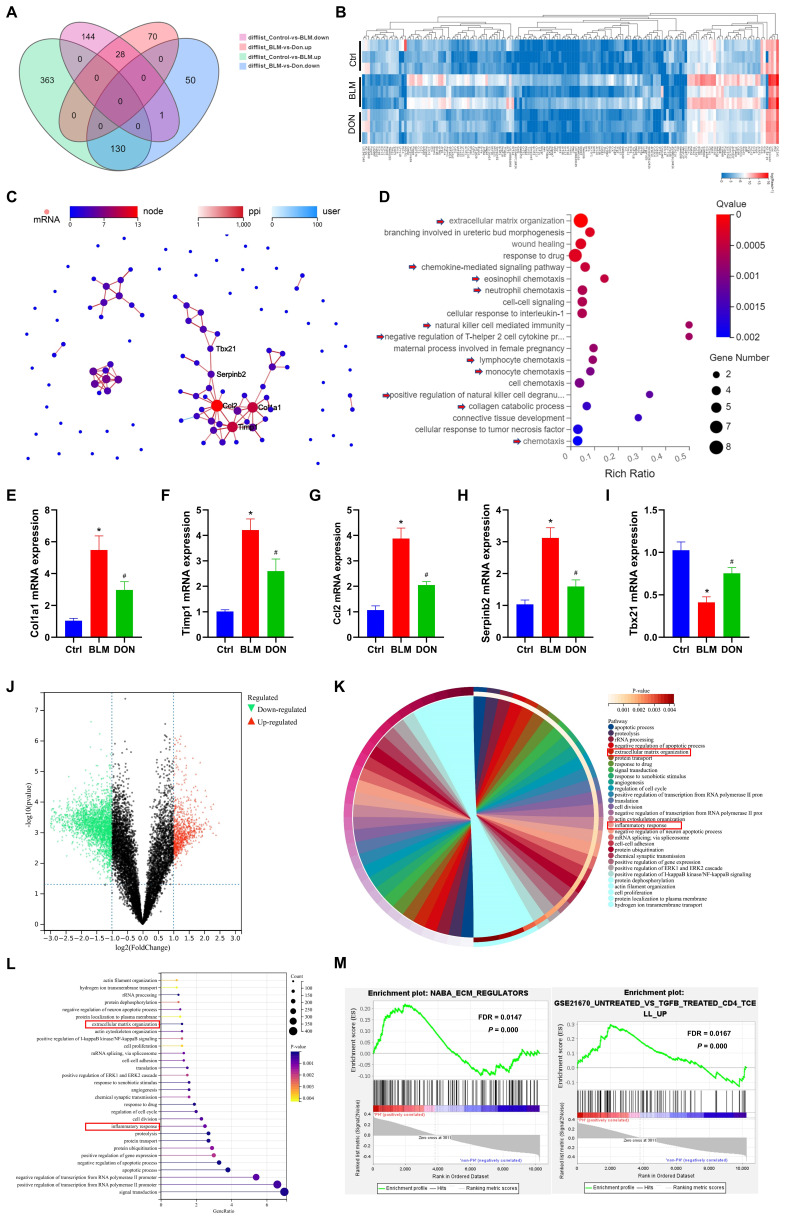
Figure 2.
DON improved fibrotic and inflammatory effects in lung fibrotic process. A. Venn diagram of the DEGs in each group identified by RNA-seq. B. Heat map of RNA-seq expression data showing 159 genes that were differentially regulated in BLM‑induced mice after DON treated (n = 3). C. PPI network of DEGs, among which, Col1a1, Timp1, Ccl2, Serpinb2, and Tbx21 were the most closely connected. D. Bubble plot of GO analysis for the 40 functional most connected genes in the PPI network. E~I: Statistical analysis of the mRNA expression of Col1a1, Timp1, Ccl2, Serpinb2, and Tbx21 in lung tissue. J. volcano plot to show the DEGs between patients with PH secondary to lung fibrosis (n = 78) and non-PH controls (n = 44). K. Chord plot to show GO-enriched items of DEGs. L. Lollipop graph to show GO-enriched items of DEGs. M. The GSEA analysis revealing the enriched pathways in the patients with PH and control samples. Ctrl: control, BLM: bleomycin, DON: donepezil. DEGs: differentially expressed genes, GO: gene ontology, GSEA: gene set enrichment analysis, PPI: protein-protein interaction. *P < 0.05, versus Ctrl group, #P < 0.05, versus BLM group.

