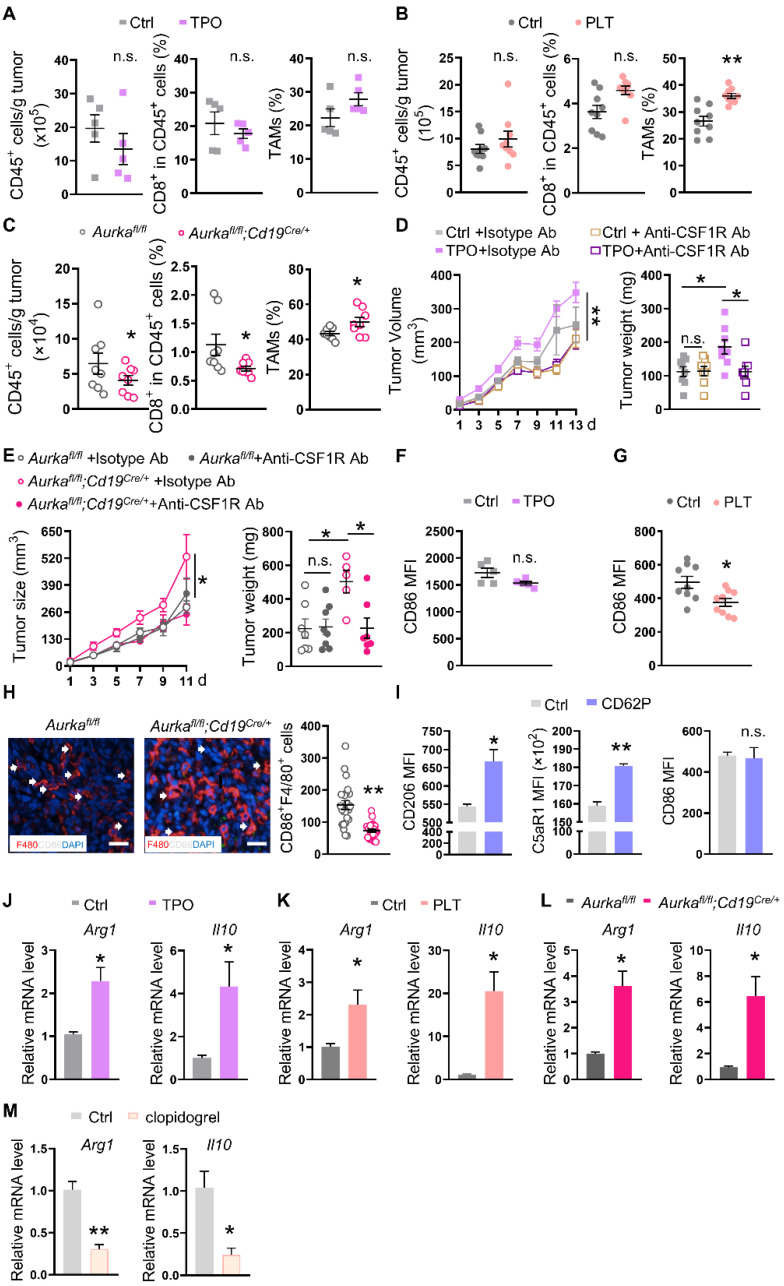
Figure 2.
Increased platelets rely on TAMs to drive tumor development. (A-C) At the end of the experiment, the tumors were obtained, and single cells were prepared. The population of intratumoral CD45+ cells (left panel), the percentage of CD8+ T cells among CD45+ cells (middle panel), and TAMs among CD45+ cells (right panel) were investigated by FACS (A: n = 5 (another 5 tumor samples for TAM sequencing and C5aR1 analysis); B: n = 9; C: n = 8). (D-E) Tumor growth and tumor weights were examined (D: n = 8; E: Aurkafl/fl n = 7 (ctrl) and 8 (anti-CSF-1R), respectively, Aurkafl/fl;Cd19cre/+ n = 5 (ctrl) and 7 (anti-CSF-1R), respectively). (F-G) The expression of CD86 on TAMs was analyzed by FACS (F: n = 5; G: n = 9). (H) Immunofluorescence analysis of F4/80 (red), CD86 (white), and DAPI (blue) in tumor sections from Aurkafl/fl and Aurkafl/fl;Cd19cre/+ mice. The CD86+ F4/80+ cells were counted (n = 3 mice/group, 8 slides/mouse). (I) BMDMs were treated with or without CD62P for 6 h, after which, CD206, C5aR1 and CD86 were examined by FACS (n = 3). The data shown are representative of one of two independent experiments. (J-M) The mRNA expression levels of Arg1 and Il10 in TAMs isolated from mice bearing tumors were examined by real-time RT-PCR (n = 3). The data shown are representative of a single experiment. **P < 0.01; *P < 0.05; n.s., not significant.

