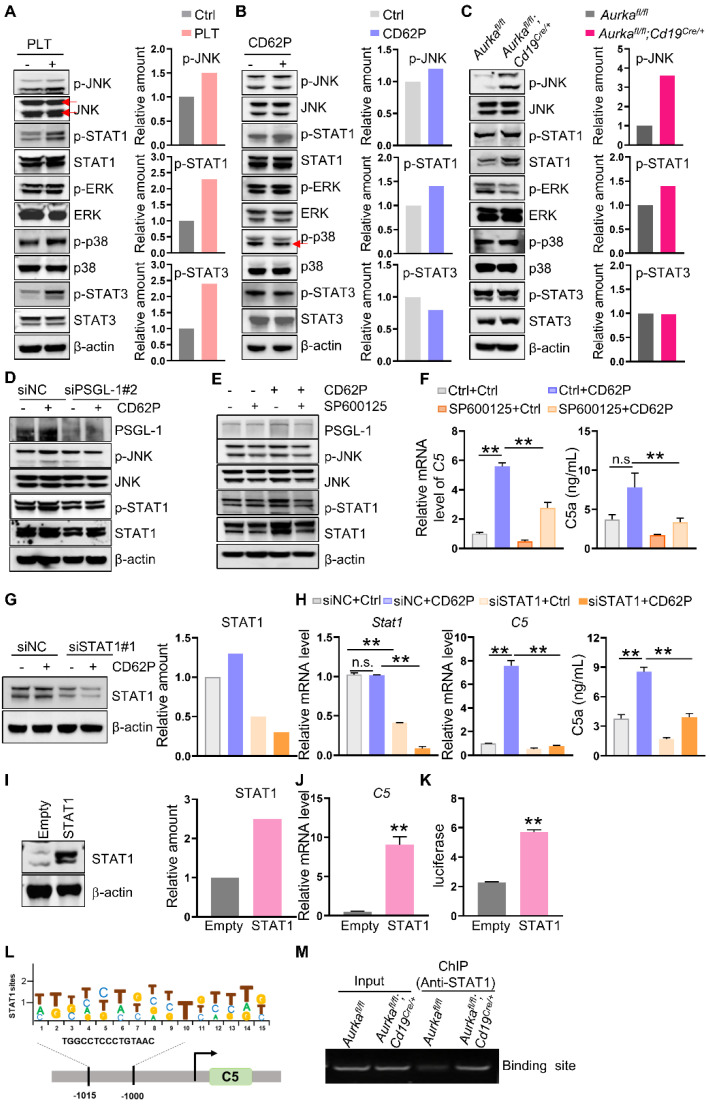
Figure 5.
Platelets regulate JNK/STAT1 signaling and drive C5 transcription in a PSGL-1 dependent manner. (A-C) BMDMs were treated as indicated. After 6 h, total cell lysates were analyzed by immunoblotting. The levels of p-JNK, p-STAT1 and p-STAT3 were quantified by densitometry, normalized to actin, and plotted (right panel). (D) BMDMs were transfected with a negative control siRNA or an siRNA against PSGL-1 in the absence or presence of CD62P. After 24 h, cell lysates were harvested and subjected to immunoblotting. (E) BMDMs were treated with SP600125 and/or CD62P. After 18 h, cell lysates were harvested and subjected to immunoblotting. (F) BMDMs were treated with SP600125 and/or CD62P. After 18 h, RNA was extracted, and the levels of C5 mRNA were examined by real-time RT-PCR. The cell culture medium was harvested, and C5a was examined (right panel). (G) BMDMs were transfected with a negative control siRNA or siSTAT1 in the presence or absence of CD62P. Twenty-four hours later, cell lysates were harvested and subjected to immunoblotting. The amount of STAT1 was quantified by densitometry, normalized to actin, and plotted (right panel). (H) BMDMs were treated with negative control siRNA or siSTAT1 in the presence or absence of CD62P. After 24 h, RNA was extracted and subjected to quantification of Stat1 and C5 mRNA levels by real-time RT-PCR. Cell culture medium was collected, and ELISA was used to examine the C5a concentration (right panel). (I) RAW264.7 cells were infected with empty or STAT1 lentivirus and selected with puromycin to establish stable cell lines. Cell lysates were extracted and subjected to immunoblotting. The levels of STAT1 were quantified by densitometry, normalized to actin, and plotted (right panel). (J) Real-time RT-PCR was used to quantify C5 mRNA levels in RAW264.7-Empty and RAW264.7-STAT1 cells. (K) Luciferase assays were performed to verify the increase in C5 transcriptional activity in 293T cells after the overexpression of STAT1. (A-K) The data are representative of one of two independent experiments. (L) STAT1 binds to the C5 gene promoter. Location and sequence of STAT1 response elements. (M) BMDMs were harvested and subjected to ChIP assays to examine STAT1 binding sites on the C5 promoter. bp, base pair. The data shown are representative of one of two independent experiments. **P < 0.01; n.s., not significant.

