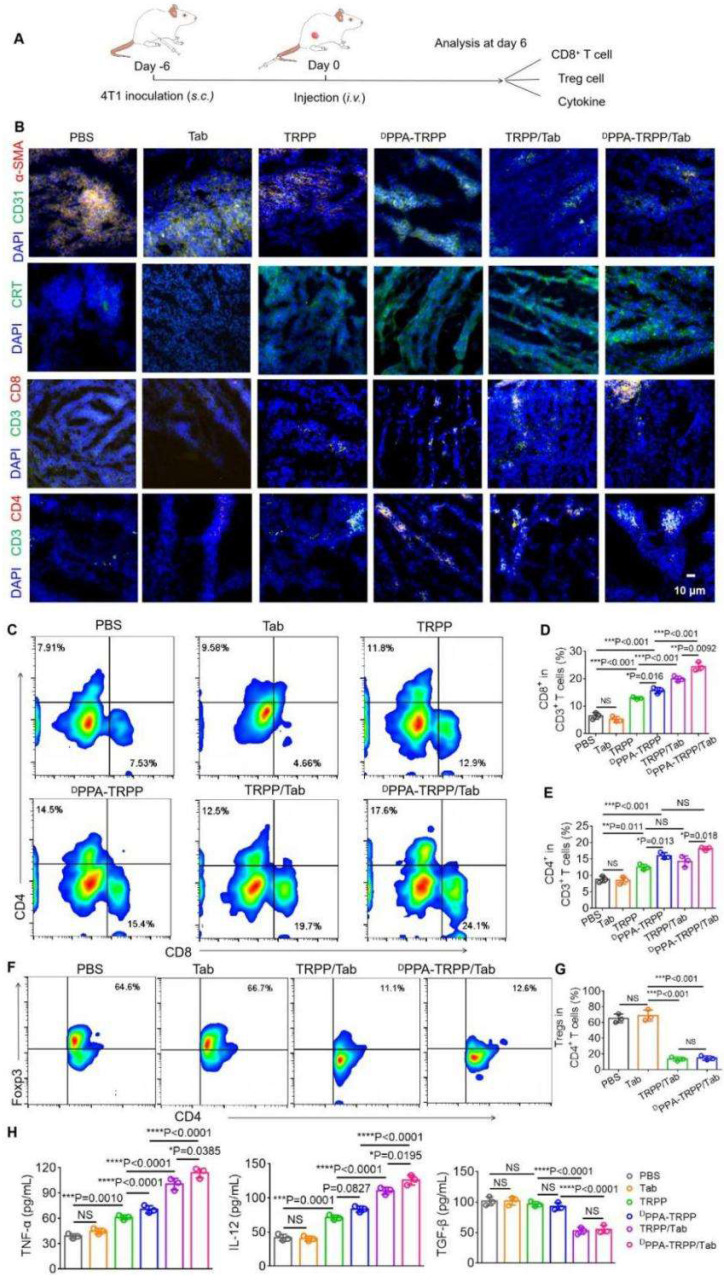
Figure 3.
In vivo tumor microenvironment modulation after DPPA-TRPP/Tab treatment at day 6 after 4T1 tumor inoculation into BALB/c mice. The mice were divided into PBS, Tab, TRPP, DPPA-TRPP, TRPP/Tab, and DPPA-TRPP/Tab groups (n = 3/group). (A) Schematic illustration for the tumor inoculation, drug administration and analysis. (B) α-SMA staining for CAFs characterization, CRT staining for ICD, CD8+ and CD4+ T cell infiltration in tumor tissue after different treatments. (C) Representative CD8+ CD4+ T cell percentages and (D, E) quantitative analysis in tumor tissue after different treatments by flow cytometry measurement. (F) Representative Foxp3+ CD4+ percentage and (G) quantitative analysis. (H) Cytokines TNF-α, IL-12 and TGF-β in serum were detected via ELISA after treatment. *P < 0.05, **P < 0.01, ***P < 0.001, ****P < 0.0001 by analysis of ANOVA with Tukey's post-hoc test.

