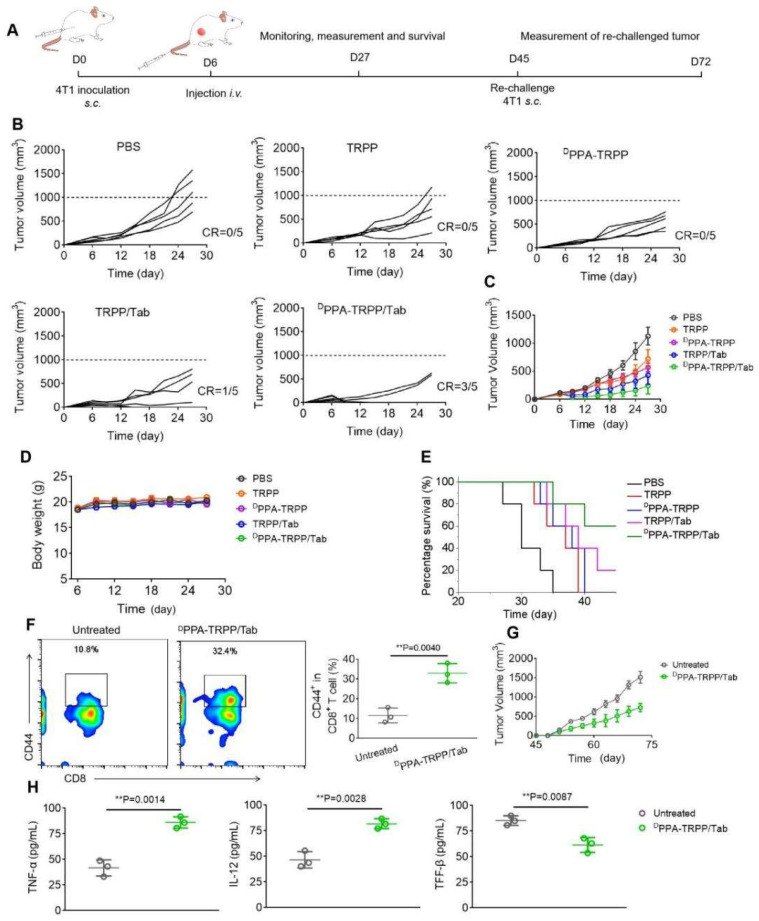
Figure 4.
In vivo antitumor activity and long-term memory immune response of DPPA-TRPP/Tab in 4T1 tumor model. (A) Schematic illustration for the tumor inoculation, drug administration, tumor volume monitoring and analysis. The drug was administered at day 6 post inoculation. Mice were randomly divided into five groups: PBS, TRPP, DPPA-TRPP, TRPP/Tab, and DPPA-TRPP/Tab (n = 5/group). (B) Individual and (C) average tumor volume growth curve after different treatments. CR represented complete tumor regression. (D) Body weight changes. (E) Survival curves. (F) CD44+ CD8+ T cell percentage and quantitative analysis. (G) Rechallenge-tumor volume growth curve. (H) Cytokine detection in serum of mice at day 7 post rechallenging. **P < 0.01 by analysis of ANOVA with Tukey's post-hoc test.

