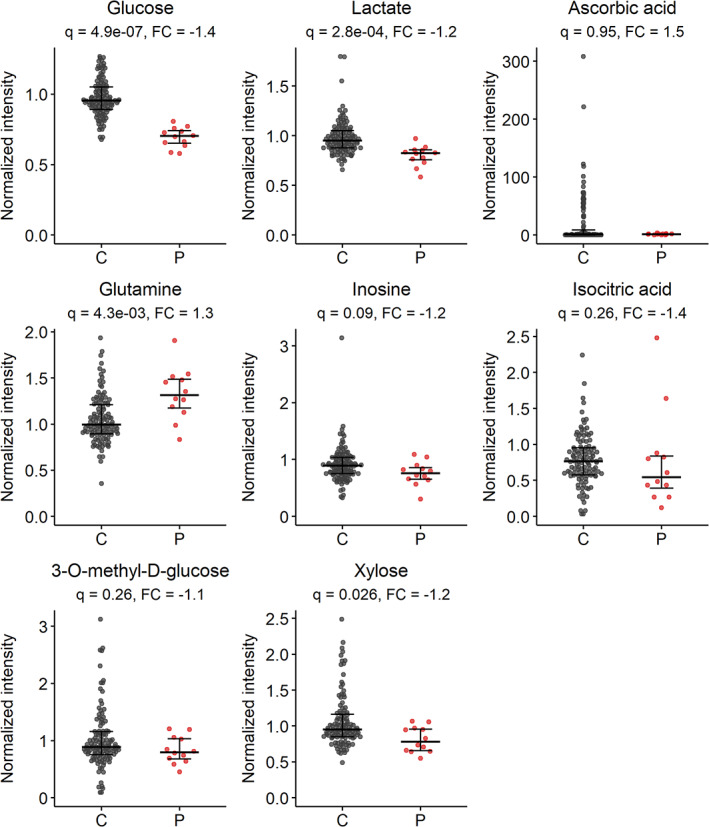
FIGURE 1.

Normalized intensities of metabolites from targeted analysis. Metabolites include glucose (13C isotope of [M + Cl]− adduct, m/z 216.0362), lactate (13C isotope of the [M − H]− adduct, m/z 90.0278), ascorbic acid ([M + H]+ adduct, m/z 177.0394), glutamine (13C isotope of [M − H]− adduct, m/z 146.0646), inosine ([M + H]+ adduct, m/z 269.0880), isocitric acid ([M + Na]+ adduct, m/z 215.0162), 3‐O‐methyl‐d‐glucose ([M + Na]+ adduct, m/z 217.0683), and xylose ([M + Cl]− adduct, m/z 185.0222). Data include all control (C) and patient (P) samples (n = 116 and 12, respectively). Bars represent median with interquartile range. q = adjusted p‐value (Wilcoxon rank‐sum test with Benjamini–Hochberg correction), FC, fold change (calculated by median[P]/median[C])
