FIGURE 3.

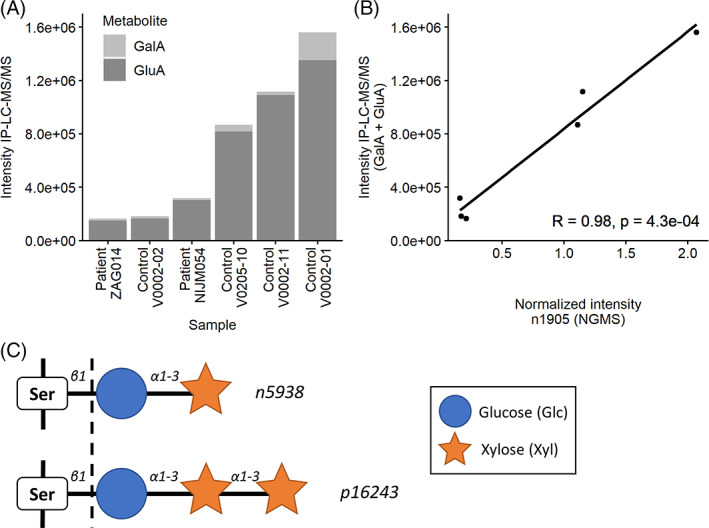
Annotation of selected features. (A) Intensities of galactonic acid (GalA) and gluconic acid (GluA) in a subset of six samples (two patients, four controls) as measured by ion‐pair liquid chromatography tandem mass spectrometry (IP‐LC–MS/MS). (B) Correlations between the normalized intensity of n1905 as measured by NGMS and cumulative intensities of GalA and GluA measured by IP‐LC–MS/MS. R, Pearson's correlation coefficient. (C) Features n5938 and p16243 were annotated as xylose‐α1‐3‐glucose and xylose‐α1‐3‐xylose‐α1‐3‐glucose, respectively. These oligosaccharides are usually linked to serine (Ser) residues in epidermal growth factor‐like repeats of proteins through a process called O‐glucosylation. 18 , 19 However, we found them in an unbound form (indicated by the dotted line)
