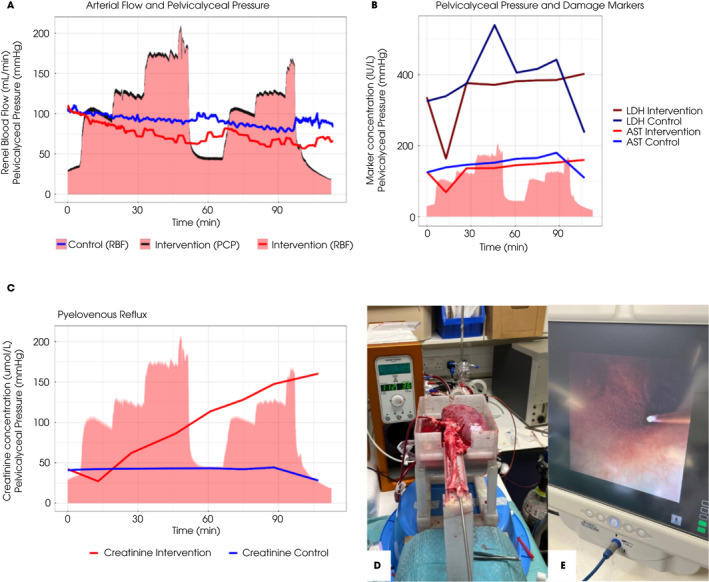
Fig. 1.

Ureteroscopy during ex vivo normothermic kidney perfusion. (A) Renal blood flow (RBF) for the intervention kidney (red line) and control kidney (blue line), overlaid on pelvicalyceal pressure (PCP) exerted on the intervention kidney (black line, red area). The adverse effect of raised pressures on RBF can be seen. (B) Damage markers (lactate dehydrogenase [LDH] and aspartate aminotransferase [AST]) overlaid on the same PCP curve. There was no significant difference between the two kidneys. (C) Appearance of creatinine in the perfusate of the kidney undergoing intervention indicates pyelovenous reflux, which can be quantified. (D) Image showing ex vivo perfused kidney and experimental set‐up. (E) Endoscopic image showing the pressure wire tip positioned in the collecting system. All images and data were derived from the third of three reported pilot experiments.
