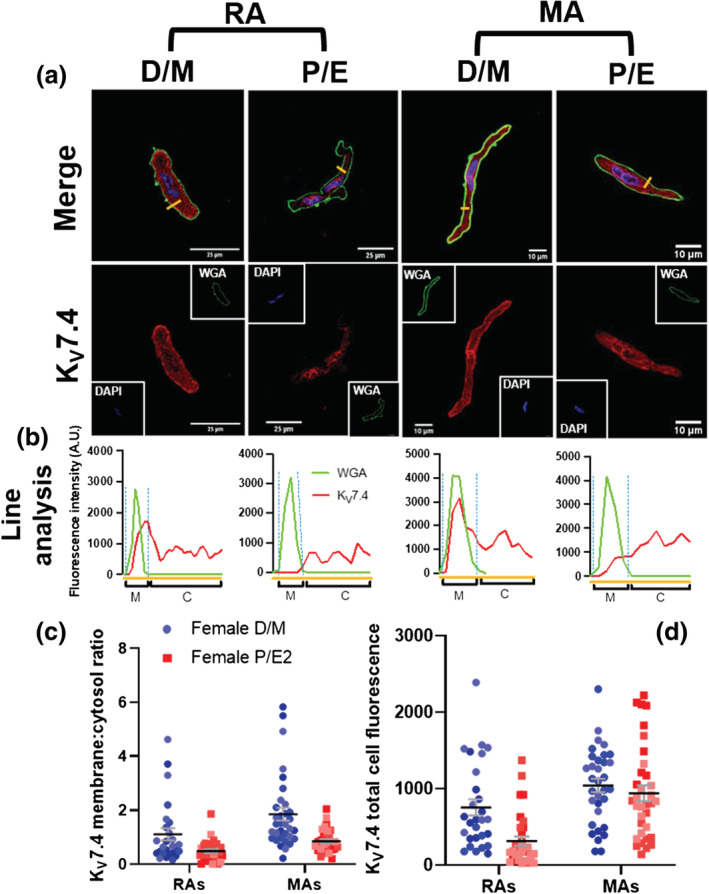
FIGURE 5.

Oestrous cycle‐dependent reduction in KV7.4 subcellular distribution in mesenteric and renal artery myocytes. Representativeimages of immunocytochemistry demonstrate KV7.4 expression (red) within renal (RA)and mesenteric (MA; a) artery vascularsmooth muscle cells from female di‐oestrus/met‐oestrus (D/M) and female pro‐oestrus/oestrus (P/E) Wistar rats. Plasma membraneand nuclear markers, wheat germ agglutinin (WGA; green) and 4′,6‐diamidino‐2‐phenylindole (DAPI; blue), respectively, are alsoshown. Fluorescence intensity profiles were plotted for KV7.4 and WGA measured in arbitrary units (A.U.) along the yellow line seenin the merged image above (b). Fluorescence intensity ≥ 200 A.U. was considered as the plasma membrane (M), and below the threshold was considered as the cytosol (C; b). The membrane:cytosol ratio for KV7.4 expression was calculated by measuring thefluorescence intensity of KV7.4 within the membrane and dividing it by the fluorescence intensity of KV7.4 within cytosol from threerandomly drawn lines. Data shown are scatterplots for membrane:cytoplasm ratio (c)and total fluorescence (d)from 8‐12 individualcells isolated from 3rats. Different colours represent different animals. The mean ± SEM are included in theplot.
