
FIGURE 1.
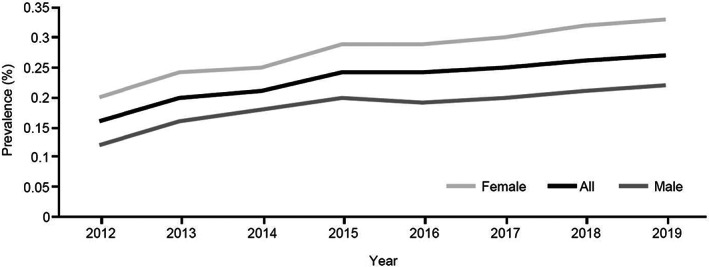
Alopecia areata (AA) yearly prevalence (percentage) trend from 2012 to 2019 according to sex. The prevalence rate (percentage) was measured as (number of cases [new and old]/total population) × 100. Data according to the Japan Medical Data Center Claims Database.