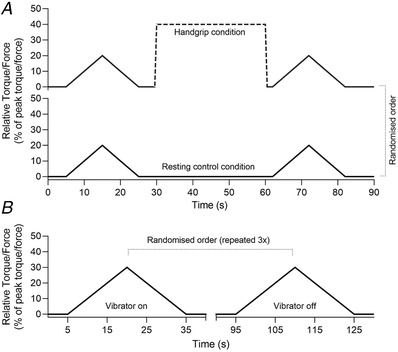
Figure 1. Design of Experiments 1 and 2.

A, Experiment 1 design with the handgrip condition shown at top and control condition at bottom. B, Experiment 2 design. In both experiments, PICs were estimated during submaximal ramp‐shaped contractions with rate of torque rise and decline of 2%/s. The contraction intensities were 20% of peak torque (20 s total duration) and 30% of peak torque (30 s total duration) for Experiments 1 and 2, respectively.
