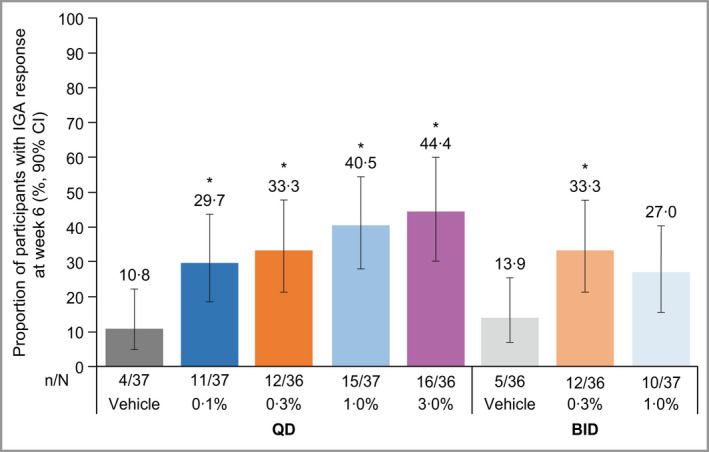
Figure 2.

Proportion of participants with AD, with IGA ‘clear’ or ‘almost clear’ and with ≥ 2‐point reduction from baseline at week 6. Unadjusted, one‐sided P‐values: *P < 0·05 vs. respective vehicle. Analysis by exact Chan and Zhang method 46 on the full analysis set using nonresponder imputation. AD, atopic dermatitis; BID, twice daily; CI, confidence interval; IGA, Investigator’s Global Assessment; QD, once daily. [Colour figure can be viewed at wileyonlinelibrary.com]
