
FIGURE 1.
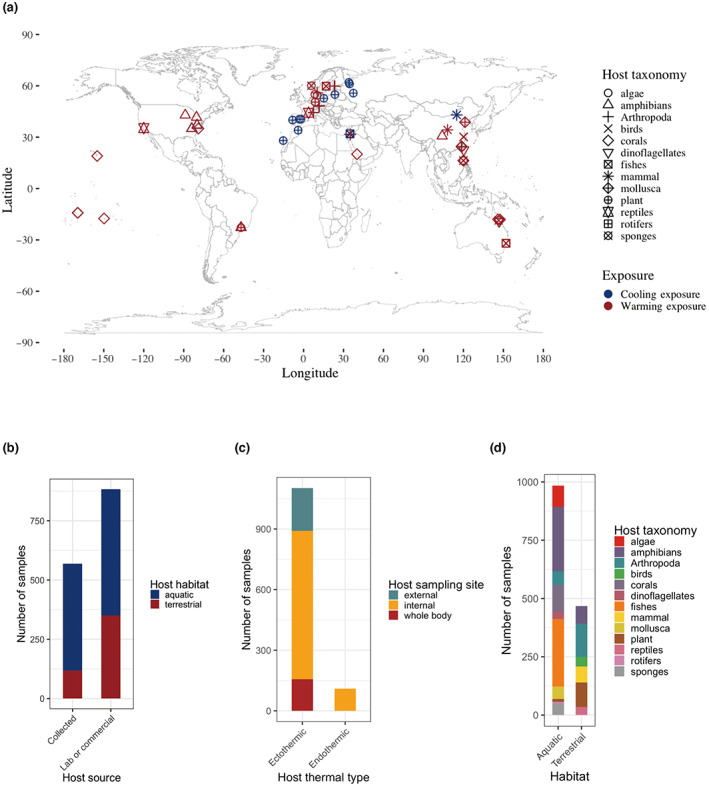
Study and sample characteristics. (a) Geographical locations of field‐collected hosts (map lines delineate study areas and do not necessarily depict accepted national boundaries). Shape represents different host taxonomy, color represents warming or cooling exposures. (b) Number of samples for different host types (aquatic vs. terrestrial; newly collected from the wild or reared in lab). (c) Number of samples for different host body sites (internal or external) from ectothermic and endothermic hosts. (d) Number of samples from different host taxa in aquatic or terrestrial habitats.