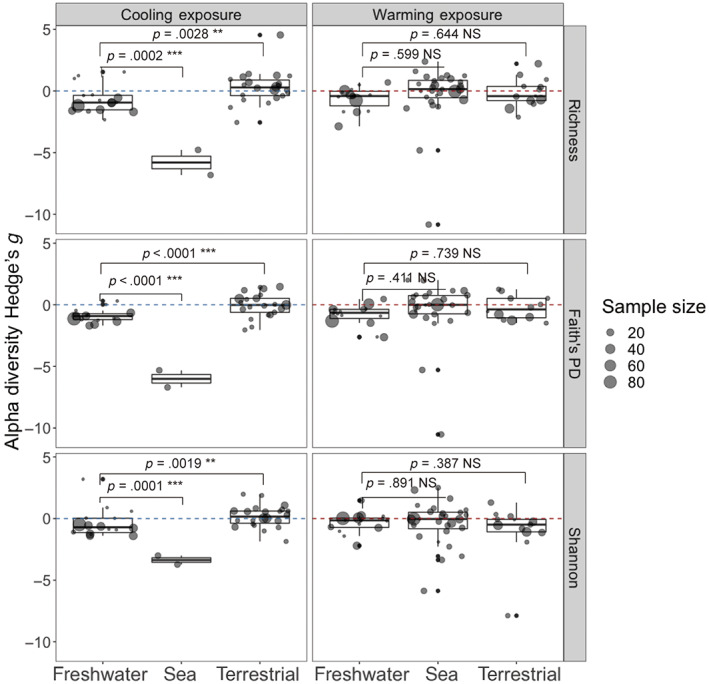
FIGURE 5.

The impact of host habitat on the response of host microbiome alpha diversity to thermal change. Points are individual Hedges' g, with sizes showing sample size used for Hedges' g calculation. Points below the blue (under cooling exposure) or red (under warming exposure) dotted line mean Hedges' g < 0: Decreased alpha diversity under warming or cooling treatments. Vertical panels are different thermal exposures, and horizontal panels are different alpha diversity metrics. The significance levels for freshwater versus sea and freshwater versus terrestrial are shown above respective brackets (NS: p > .05; *p < .05; **p < .01; ***p < .001).
