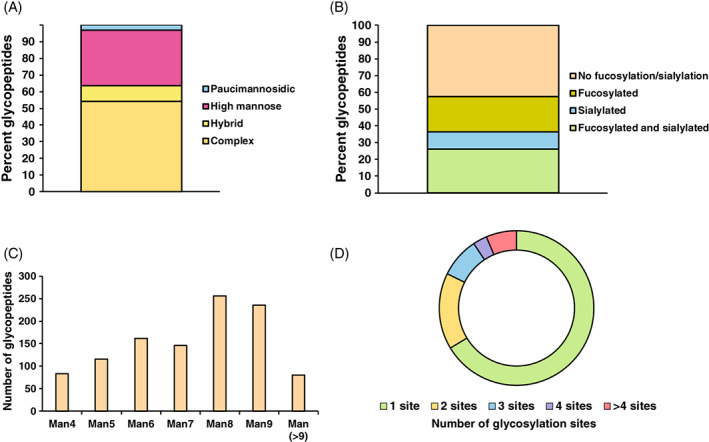
FIGURE 3.

Global view of fibroblast glycosylation. (A) All quantified glycopeptides were classified according to their category of glycans. Y‐axis represents the percent glycopeptides in each category. (B) Percentages are shown for fucosylated, sialylated, both fucosylated and sialylated and not fucosylated or sialylated glycan containing glycopeptides. (C) High‐mannose glycans containing glycopeptides are shown with numbers representing glycopeptides found with increasing hexose units. (D) All glycoproteins are divided into category of number of glycosylation sites detected per glycoprotein
