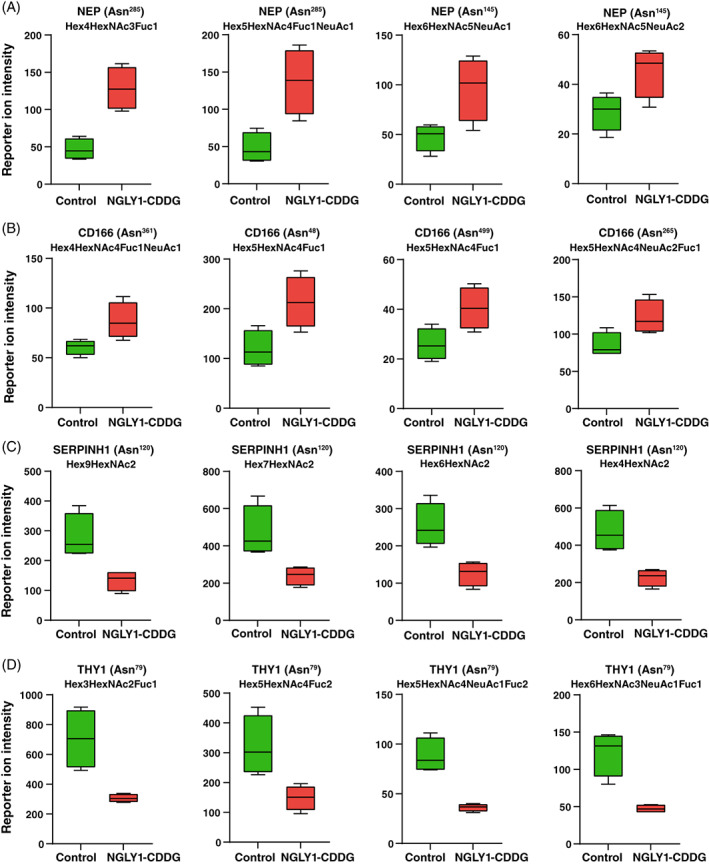
FIGURE 5.

Distinct glycosylation in extracellular matrix and cell adhesion proteins. Box plots showing reporter ion intensities of individual glycopeptides in controls and NGLY1‐CDDG patients for different extracellular matrix and cell adhesion proteins; (A) CD166, (B) neprilysin (NEP), (C) Serpin H1 (SERPINH1), and (D) thy‐1 membrane glycoprotein (THY1). NGLY1‐CDDG samples reflected the increased glycosylation in CD166 and NEP, whereas reduction in glycosylation was observed in SERPINH1 and THY1. Protein names, glycosylation sites, and glycan compositions are marked on the top of box plots and X‐axis depicts sample type while Y‐axis is reporter ion intensity at the glycopeptide level. Fuc, Fucose; Hex, Hexose; HexNAc, N‐acetylhexosamine; NeuAc, N‐acetylneuraminic acid.
