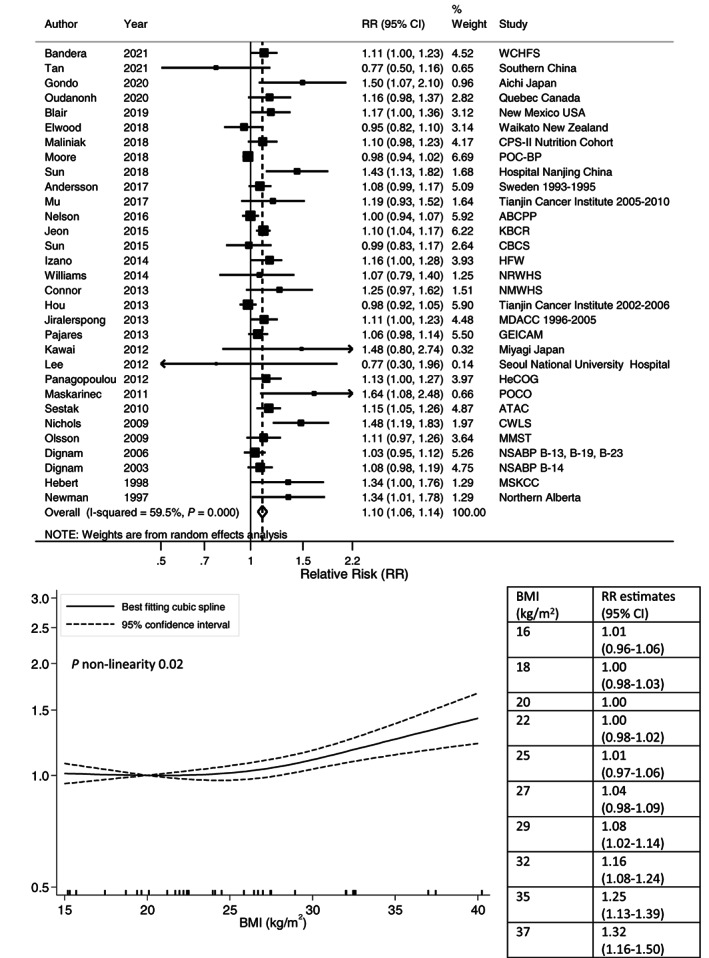
FIGURE 3.

Linear and nonlinear dose‐response meta‐analyses of postdiagnosis body mass index and breast cancer‐specific mortality. Forest plot shows the linear dose‐response results for postdiagnosis body mass index (BMI) and breast cancer‐specific mortality from the inverse variance DerSimonian‐Laird random‐effects model. Diamond represents the summary relative risk (RR) estimate and its width as the 95% confidence interval (CI). Each square represents the RR estimate of each study and the horizontal line across each square represents the 95% CI of the RR estimate. The increment unit was per 5 kg/m2. Nonlinear curve was estimated using restricted cubic spline regression with three knots at 10th, 50th and 90th percentiles of distribution of the exposure and pooled in random‐effects meta‐analysis. BMI at 20 kg/m2 was selected as reference. The table shows selected BMI values and their corresponding RR (95% CI) estimated in the nonlinear dose‐response meta‐analysis.
