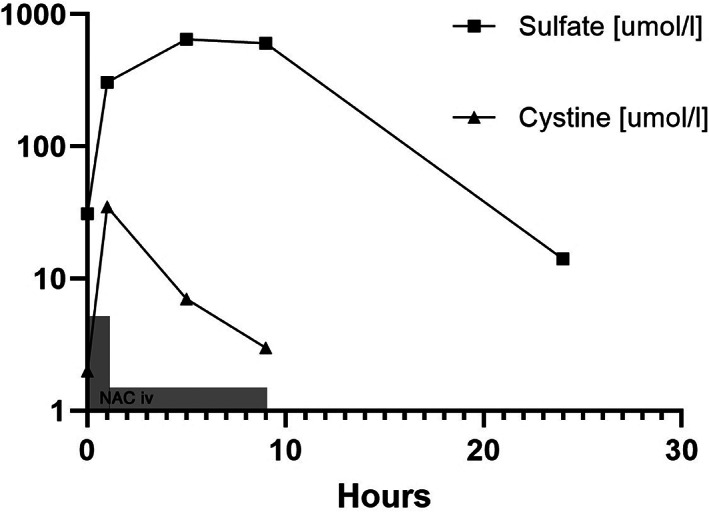
FIGURE 4.

intravenous N‐Acetylcysteine treatment. Panel C shows plasma levels of sulfate and cystine (oxidized form of cysteine) on a logarithmic scale during and after NAC infusion. The gray rectangles indicate NAC administration (not to scale). The concentration cystine peaked earlier than sulfate as expected from the metabolism of the drug.
