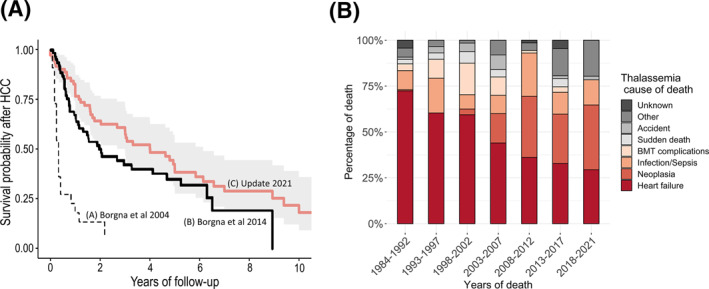
FIGURE 4.

(A) Survival after the diagnosis of HCC (Kaplan Meier Curve C): a comparison with the 2004 and 2014 cohorts of Borgna‐Pignatti et al. 1 , 6 (Kaplan Meier Curve A and B, respectively) (B) Causes of death in thalassemia. The distribution of causes of death by 5‐year periods is shown for patients with transfusion‐dependent β‐thalassemia and non–transfusion‐dependent β‐thalassemia. BMT indicates bone marrow transplantation; HCC, hepatocellular carcinoma.
