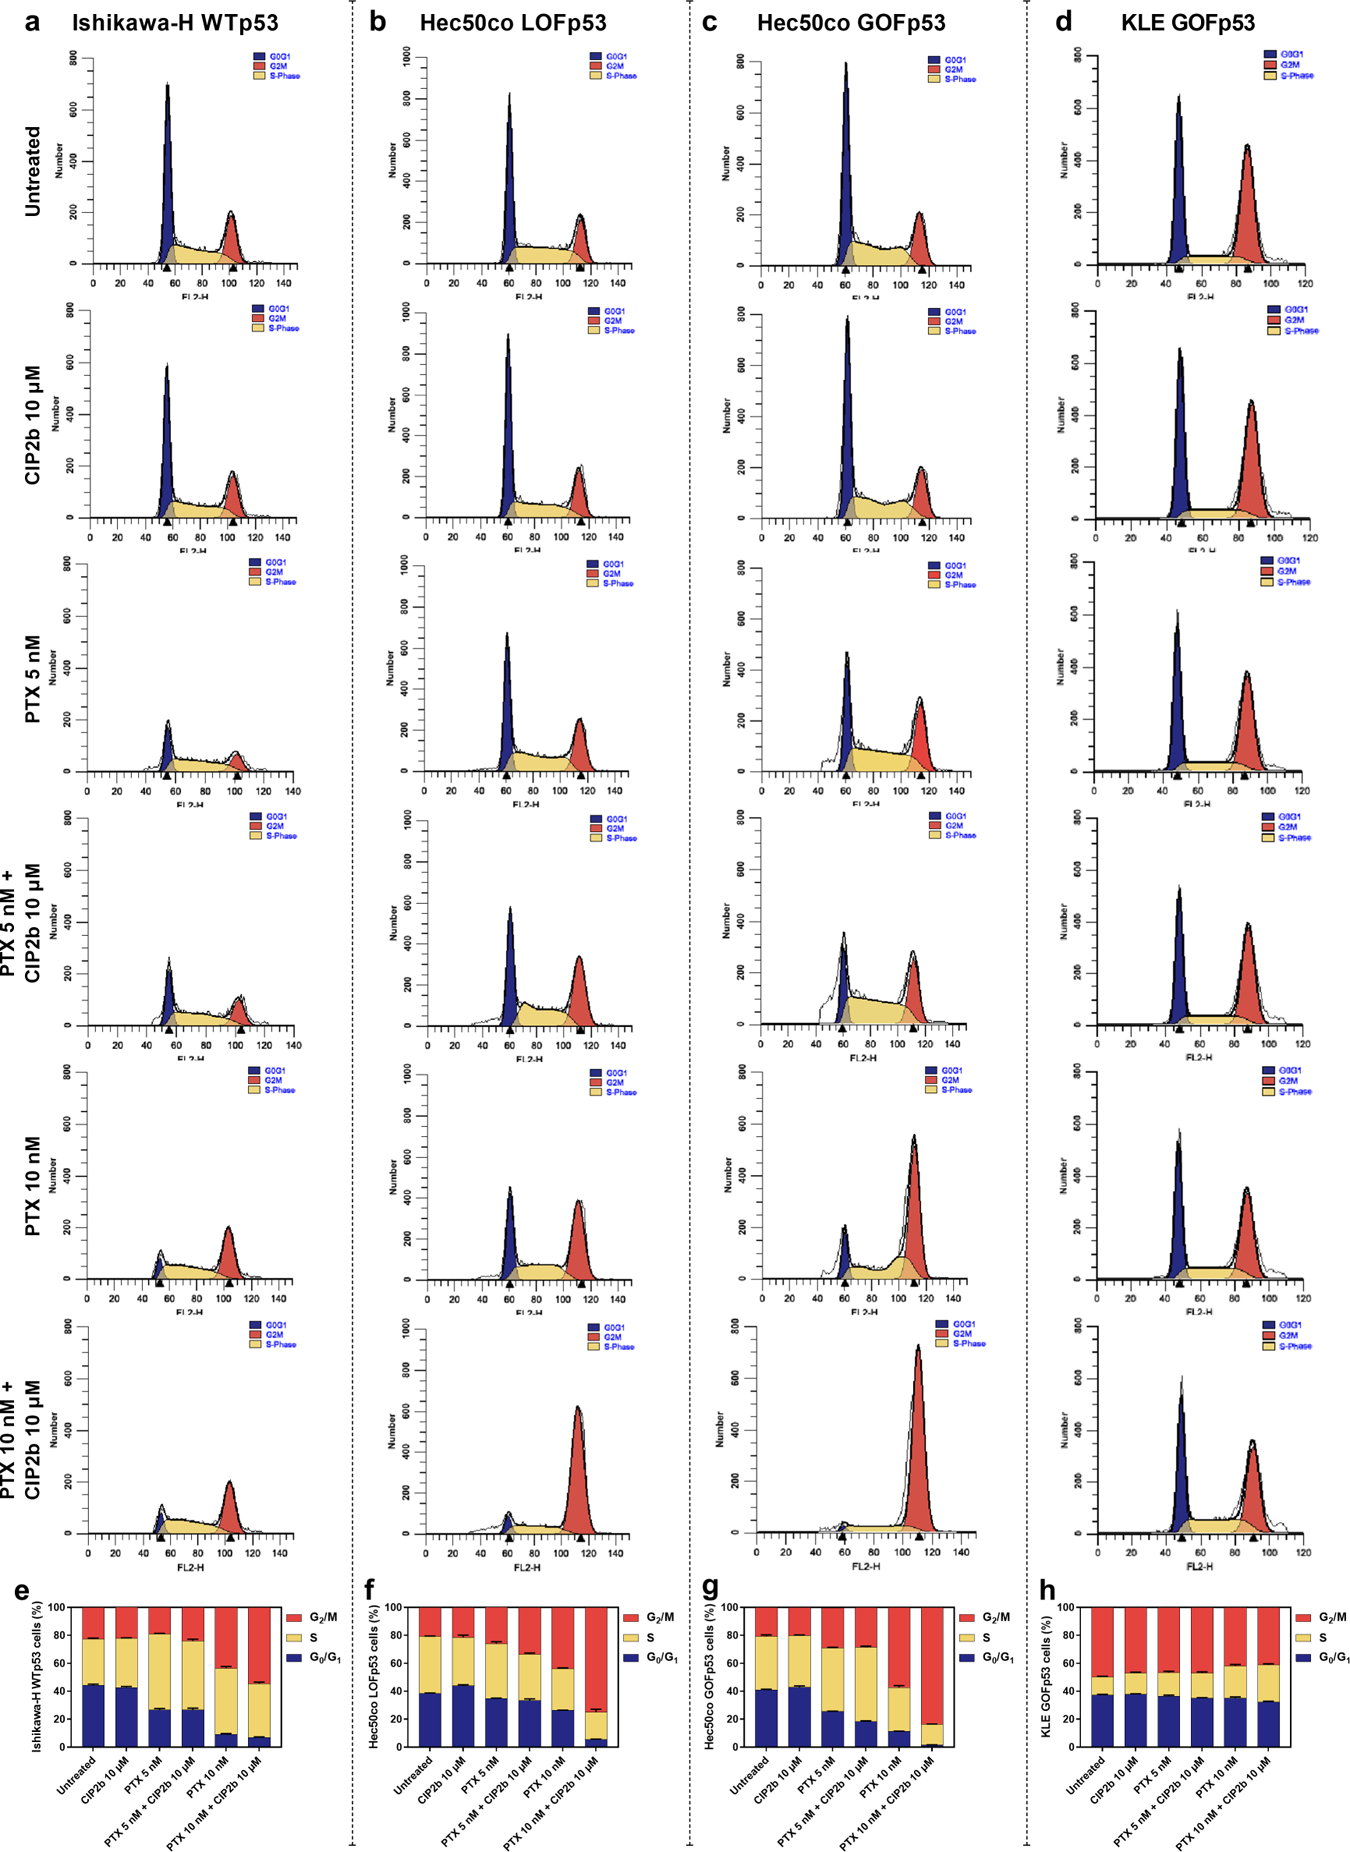
Fig. 2.

Role of the mitotic spindle checkpoint in the cellular response to the therapeutic combination of PTX + CIP2b following the cell cycle analysis using ModFit LT software. (a, b, c, and d) Histograms of Ishikawa–H WTp53, Hec50co LOFp53, Hec50co GOFp53, and KLE GOFp53 cells, respectively, with indicated treatments represent cell cycle phases: G0/G1, S, and G2/M. (e, f, g, and h) Distribution of Ishikawa–H WTp53, Hec50co LOFp53, Hec50co GOFp53, and KLE GOFp53 cells, respectively, in each stage of the cell cycle after incubation with the indicated treatment for 24 hours. Data are plotted as mean ± SD (n=3).
