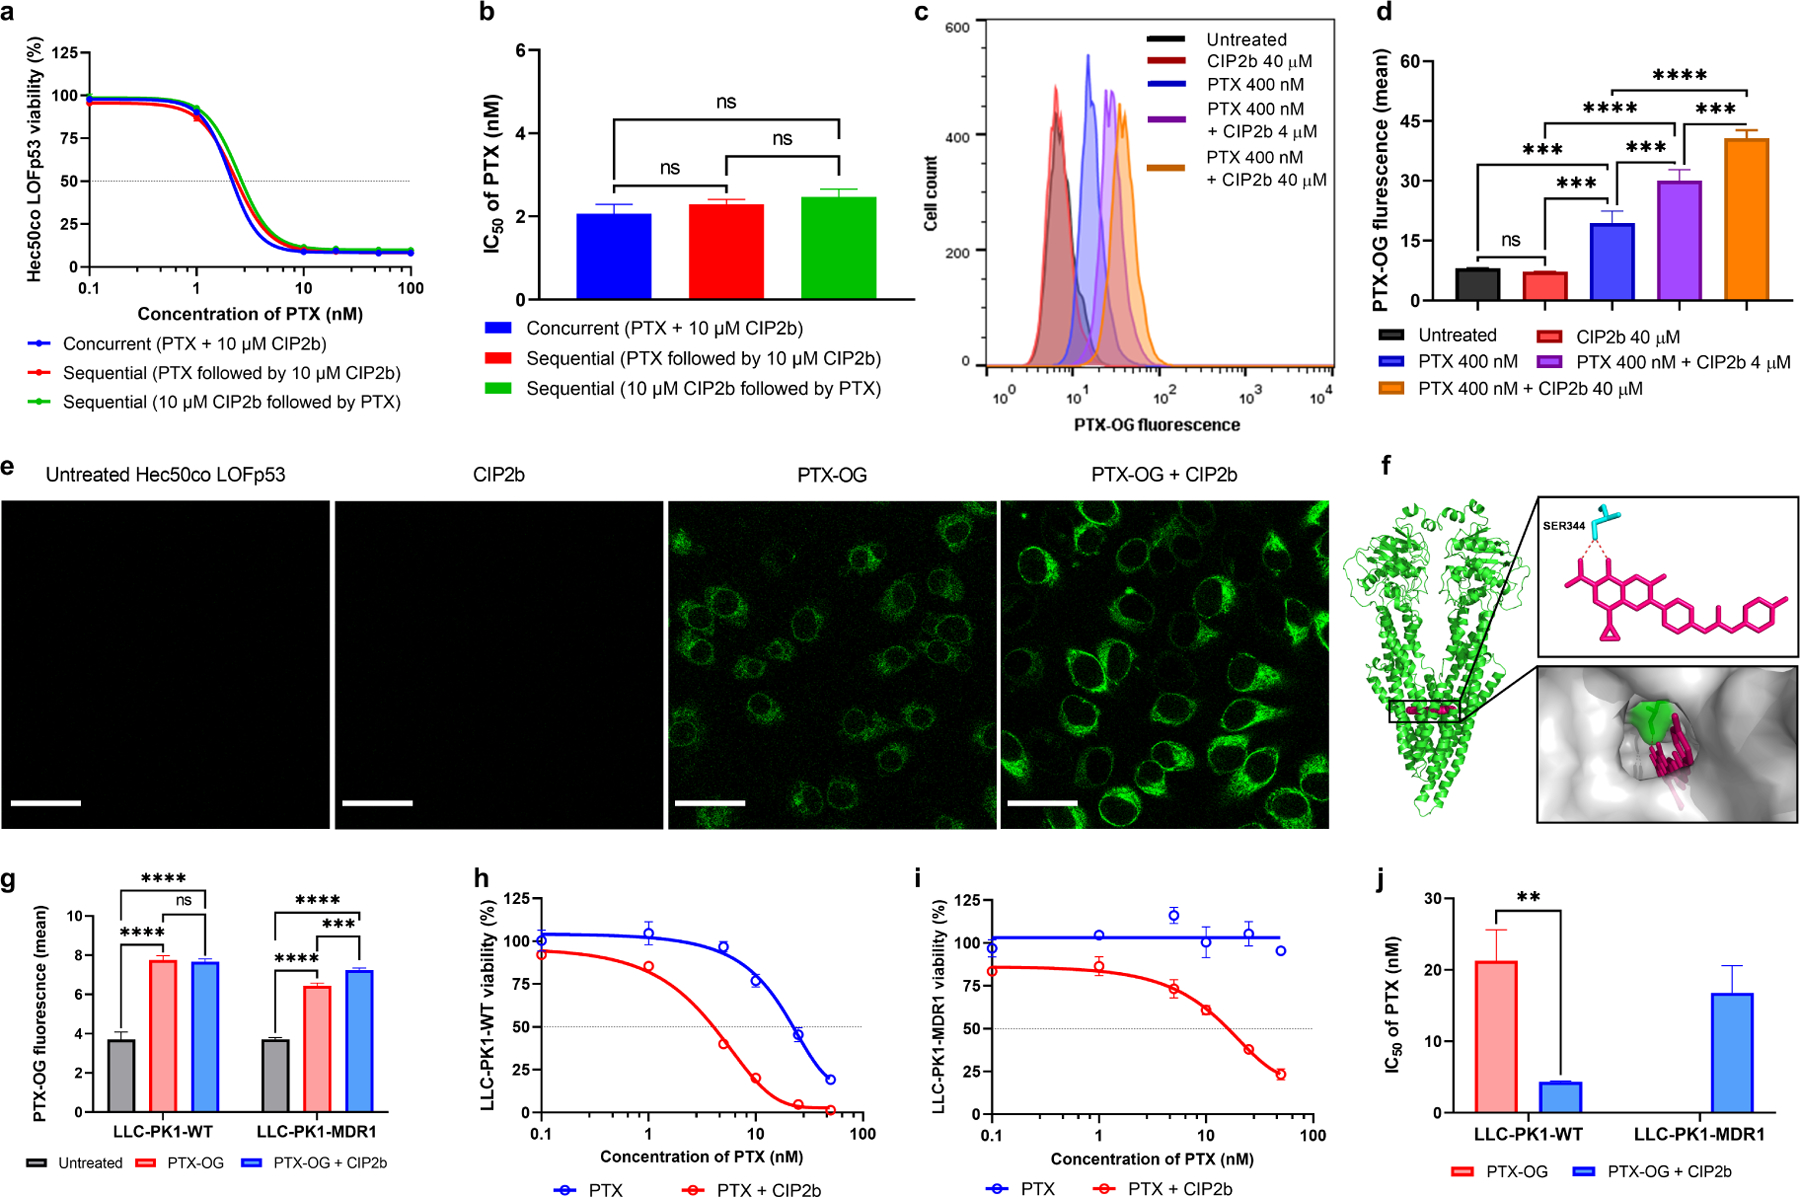
Fig. 3.

Effect of PTX + CIP2b combinatorial therapy on the MDR1. (a) Cytotoxicity assays of MDR1-expressing Hec50co LOFp53 endometrial cancer cells following treatment for 72 hours with different concentrations of PTX and fixed concentration of CIP2b (10 μM) using two different treatment strategies: concurrent treatment where both compounds were added to the cells at the same time vs sequential treatment where the PTX was added either after or before the CIP2b. (b) IC50 values of PTX following the addition of 10 μM CIP2b against MDR1–expressing Hec50co LOFp53 endometrial cancer cells. (c) Representative flow cytometric histograms of PTX–OG intracellular accumulation experiment. (d) Intracellular accumulation of PTX–OG (400 nM) in MDR1–expressing Hec50co LOFp53 cells in the presence or absence of CIP2b (4 or 40 μM) after 2 hours of treatment, as determined by flow cytometric analysis. (e) Confocal microscopy images of Hec50co cells cultured with PTX–OG ± CIP2b (scale bar = 30 μm). (f) Molecular interaction of CIP2b with human MDR1. CIP2b molecule is colored pink, the non–conventional long–distance hydrogen bond is colored red, and active site residues are colored cyan. Polar contact surfaces are presented as green while the target protein is presented as a transparent surface in gray. (g) Flow cytometric assay of the intracellular accumulation of PTX–OG (400 nM) in LLC–PK1–WT or LLC–PK1–MDR1 cells in the presence or absence of CIP2b (4 μM). (h and i) Percent cell survival following treatment of LLC–PK1–WT cells and LLC-PK1–MDR1 cells, respectively, for 72 hours with different concentrations of PTX in the presence or absence of 50 μM CIP2b. (j) IC50 values of PTX following the addition of 50 μM CIP2b against LLC–PK1–WT cells and LLC–PK1–MDR1 cells. Data are plotted as mean ± SD (n=3). A one–way (b and c) or two–way (g) ANOVA with Tukey post hoc test or one–sided t–test (j) were used for statistical analysis. **, P < 0.01; ***, P < 0.001; ****, P < 0.0001; ns, nonsignificant.
