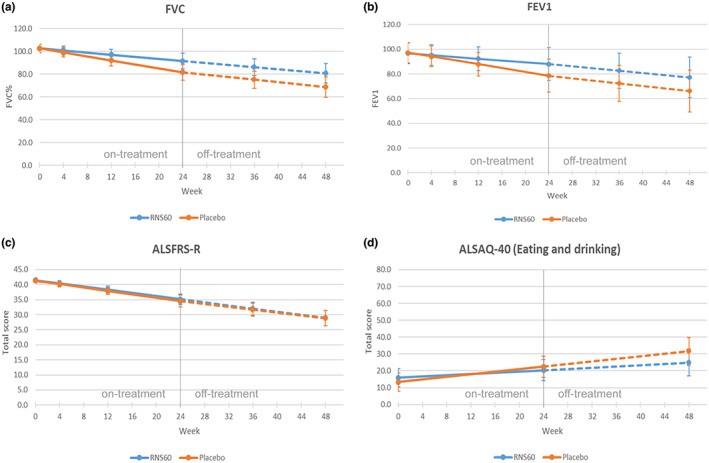
FIGURE 3.

Effect plots for FVC, FEV1, ALSFRS‐R, ALSAQ40 (eating and drinking) at different visit times (in weeks) in each treatment arm (ITT population)

Effect plots for FVC, FEV1, ALSFRS‐R, ALSAQ40 (eating and drinking) at different visit times (in weeks) in each treatment arm (ITT population)