
FIGURE 4.
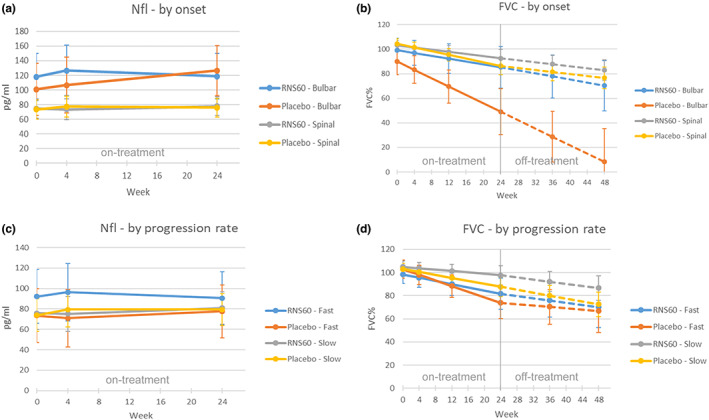
Effect plots for NfL and FVC at different visit times in each treatment arm by site of onset (ITT population)
Official websites use .gov
A
.gov website belongs to an official
government organization in the United States.
Secure .gov websites use HTTPS
A lock (
) or https:// means you've safely
connected to the .gov website. Share sensitive
information only on official, secure websites.
Effect plots for NfL and FVC at different visit times in each treatment arm by site of onset (ITT population)