FIGURE 2.

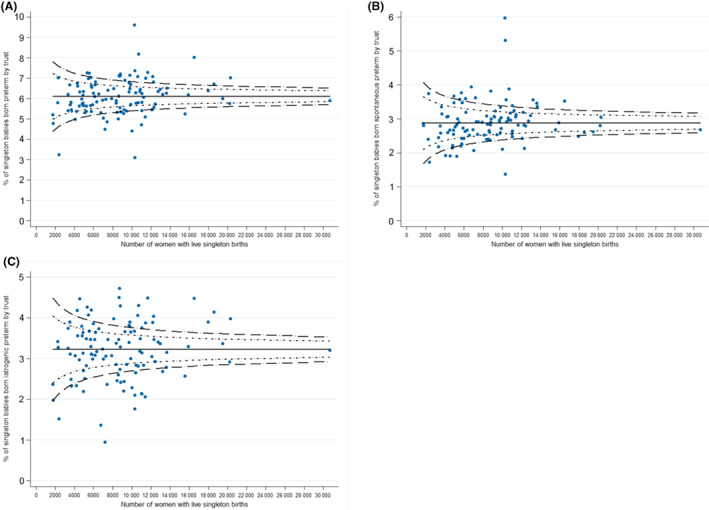
Funnel plots showing the risk‐adjusted proportion of singleton preterm births by trust of birth: (A) total preterm birth, (B) spontaneous preterm birth and (C) iatrogenic preterm birth.

Funnel plots showing the risk‐adjusted proportion of singleton preterm births by trust of birth: (A) total preterm birth, (B) spontaneous preterm birth and (C) iatrogenic preterm birth.