
FIGURE 2.
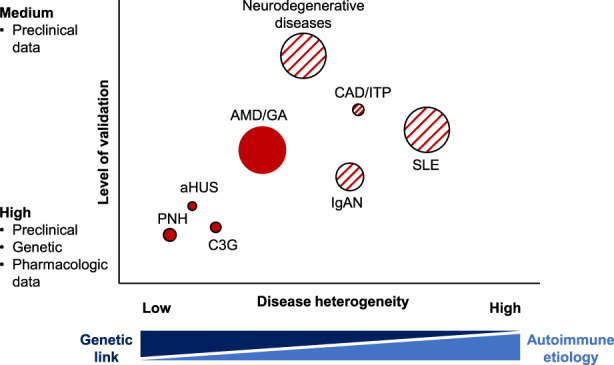
Potential indications for antagonists of the alternative complement pathway. Clinical development of factor D and factor B antagonists has been pursued in diseases of low heterogeneity and a high level of preclinical and pharmacological validation. Area of circles represents prevalence of the diseases (PNH 0.1/100.000, C3G: 0.2/100.000, aHUS: 0.3/100′000, dry AMD: 440/100′000, CAD 1.6/100′000, ITP: 9.5/100′000, IgAN: 2.5/100′000; ANCA vasculitis: 5–18/100′000; SLE: 20–150/100′000) and hatched circles indicate that clinical responses to alternative pathway antagonists may vary between patient subgroups