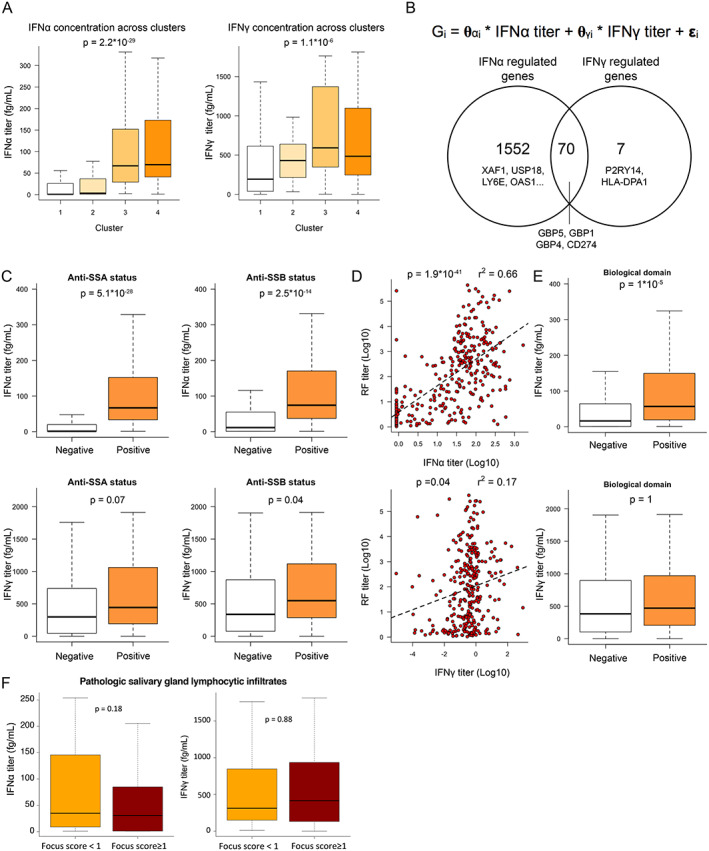
Figure 2.

Quantification of interferon‐α (IFNα) and IFNγ protein serum concentrations by digital enzyme‐linked immunosorbent assay reveals the pivotal role of IFNα in patients with primary Sjögren's syndrome (SS). A, IFNα (left) and IFNγ (right) serum titers across clusters. B, Description of the linear model used to describe gene expression (top) and Venn diagram showing the number of genes transcriptionally controlled by IFNα, IFNγ, or both (bottom). C, IFNα (top) and IFNγ (bottom) concentrations based on anti‐SSA (left) and anti‐SSB (right) status. D, Correlations between IFNα and rheumatoid factor (RF) concentrations (top) and between IFNγ and RF concentrations (bottom). Dashed lines are based on the linear regression between the 2 variables. E, IFNα (top) and IFNγ (bottom) concentrations based on presence versus absence of an active biologic domain according to components of the EULAR Sjögren's Syndrome Disease Activity Index (ESSDAI). F, Concentrations of IFNα (left) and IFNγ (right) according to focus score of inflammatory infiltrates in the salivary glands of patients with primary SS. For box plots, the line inside the box represents the median, the box represents the interquartile range, and the whiskers extend to the most extreme data point that is no more than 1.5 times the interquartile range from the box. Color figure can be viewed in the online issue, which is available at http://onlinelibrary.wiley.com/doi/10.1002/art.42265/abstract.
