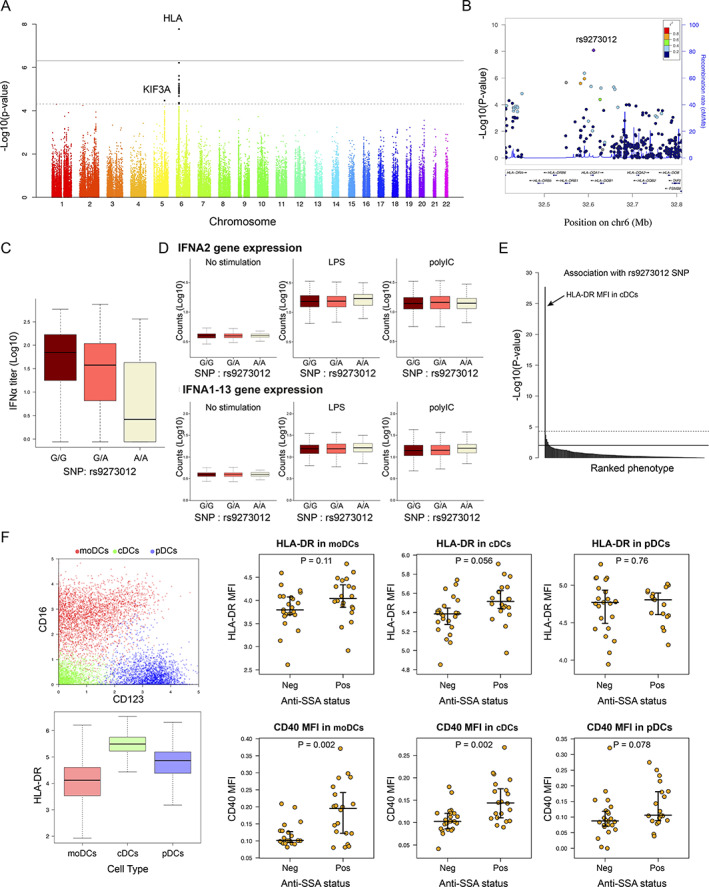
Figure 3.

Genome‐wide association study reveals a genetic determinant in patient stratification and interferon‐α (IFNα) blood concentration in patients with primary Sjögren's syndrome. A, Genome‐wide association between single‐nucleotide polymorphisms (SNPs) and IFNα concentration. Dashed line corresponds to the threshold for a suggested genome‐wide association, and solid line corresponds to a significant genome‐wide association. B, LocusZoom plot of the HLA region. C, IFNα concentration according to the rs9273012 SNP status. D, IFNα gene expression in whole blood from 1,000 healthy donors from the Milieu Intérieur cohort, under conditions of no stimulation versus stimulation with lipopolysaccharide (LPS) versus stimulation with poly(I‐C). E, P values indicating possible statistical significance of associations between the rs9273012 SNP and the 166 immunophenotypes measured in the Milieu Intérieur study from Patin et al (30). The top horizontal line represents the threshold after Bonferroni correction for multiple testing at P = 0.05. F, Mass cytometry analysis of data from Mingueneau et al (9). Panels show the 3 dendritic cell (DC) populations defined using unsupervised analysis (top left) and HLA–DR expression in the 3 DC populations (bottom left), as well as mean fluorescence intensity (MFI) results for HLA–DR (top right) and CD40 (bottom right) in the 3 DC populations based on anti‐SSA status. For box plots, the line inside the box represents the median, the box represents the interquartile range, and the whiskers extend to the most extreme data point that is no more than 1.5 times the interquartile range from the box. moDCs = monocyte‐derived DCs; cDCs = conventional DCs; pDCs = plasmacytoid DCs; Neg = negative; Pos = positive. Color figure can be viewed in the online issue, which is available at http://onlinelibrary.wiley.com/doi/10.1002/art.42265/abstract.
