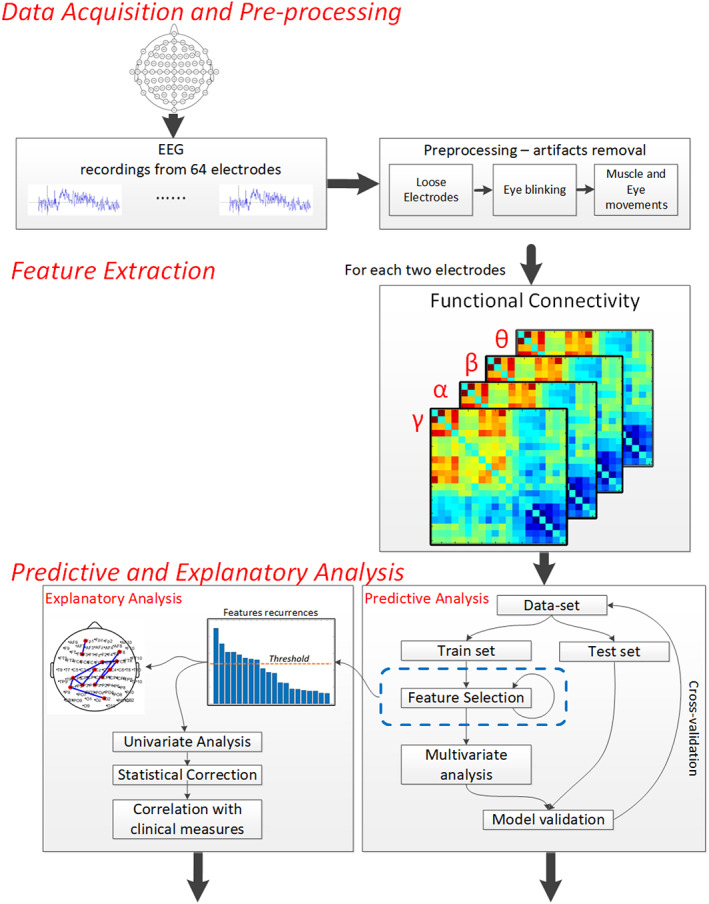
FIGURE 1.

The analysis scheme is composed of three main stages: (i) data acquisition and pre‐processing; (ii) feature extraction, including calculation of functional connectivity values between each possible pair of electrodes for each of the standard frequency bands, using the MSC and applying the ReliefF algorithm to rank the features, aiming to choose the top 10 representing the best informative subset; (iii) predictive analysis—a multivariate analysis and ROC curve representation of the selected functional connections
