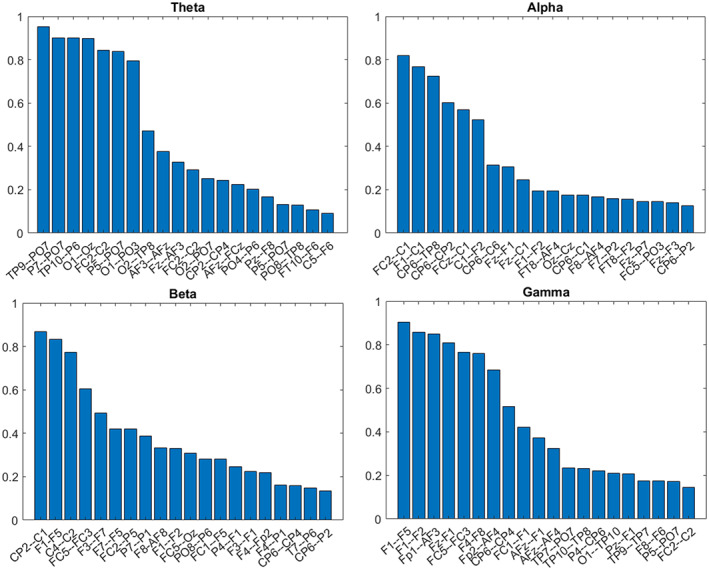
FIGURE 2.

Functional connections differentiating between painful and non‐painful diabetic neuropathy patients. The x‐axis represents the selected functional connections, and the y‐axis describes the recurrence (i.e., histogram) of each connection out of 300 reiterations on a 0–1 range. The higher the score, the higher the likelihood of the specific pair being selected in a replicative study. For example, the leftmost column in the alpha range (FC2–C1) represents an 80% chance of being found significant again in similar studies
