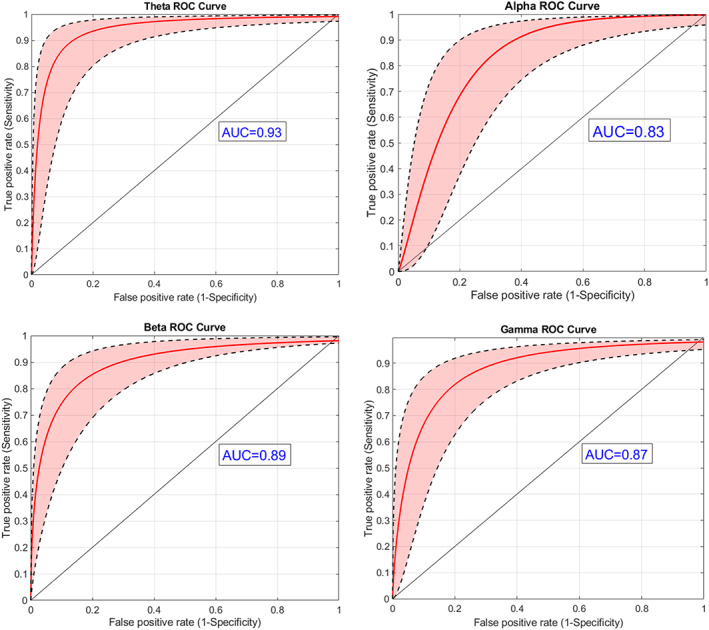
FIGURE 3.

Grouping of painful/non‐painful patients based on brain connectivity: ROC analysis (red line), with standard deviation confidence intervals (black broken lines) based on the 10 selected functional connections for each one of the frequency bands. The black diagonal line indicates an AUC of 0.5. It is evident that the theta and beta bands contain most of the information required for discrimination between painful and non‐painful neuropathy patients as reflected in the ROC curve AUC values: 0.93 for the theta band and 0.895 for the beta band. Nevertheless, the discriminability based on alpha and gamma data was relatively high as well, with AUCs of 0.83 and 0.87, respectively
