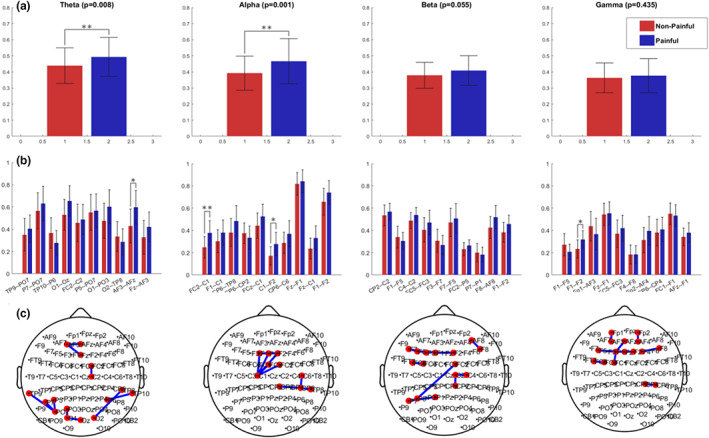
FIGURE 4.

(a) Average connectivity values of the 10 most differentiating connections for the painful (red) and non‐painful (blue) DPN patients; (b) within‐band particular functional connections average values; (c) the cortical locations of those functional connections. Asterisks indicate significant connections after Bonferroni correction (*p < 0.05; **p < 0.005)
