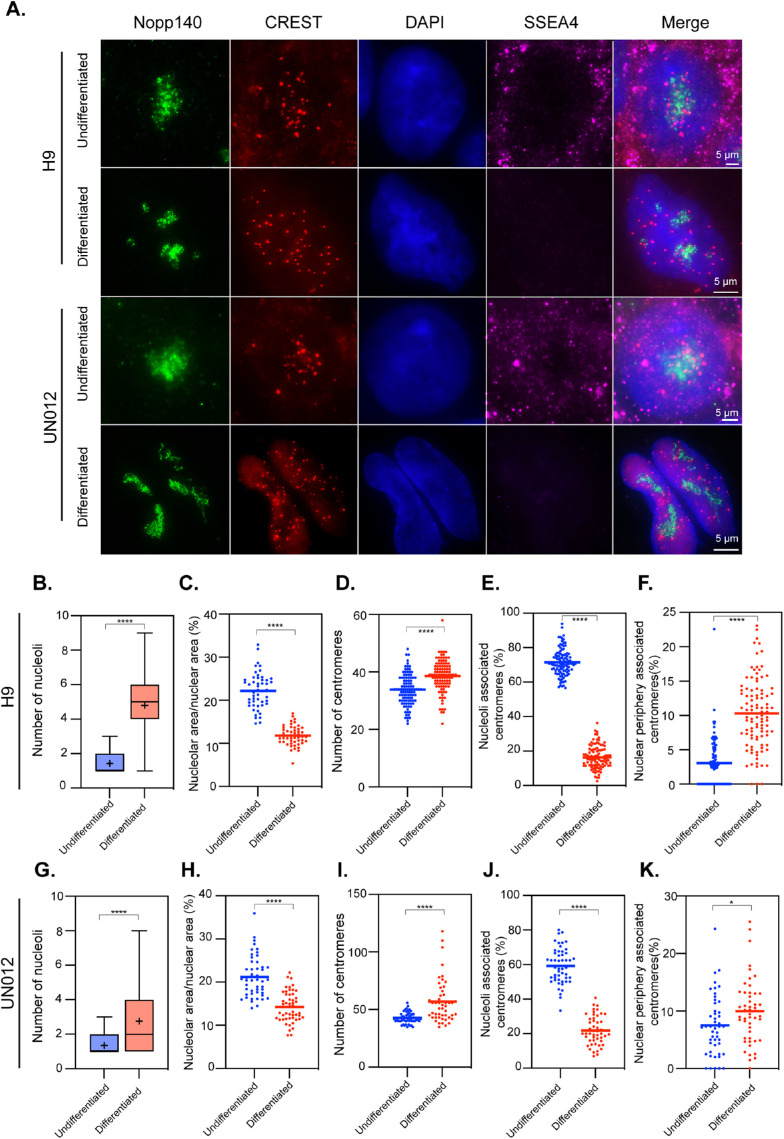
FIGURE 1:
Nucleolus–centromere interactions decrease as H9 human embryonic stem cells and SSL012 iPS cells differentiate. Nucleoli are immunolabeled with anti-Nopp140 antibody (green) and centromeres by CREST (red) antibodies. Pluripotency was verified using SSEA4 antibody, which is lost in differentiating cells (A). The number of nucleoli (B, G) increases as nucleolar area (ratio of nucleolar area over nuclear area) decreases (C, H). The number of countable centromeres increases as cells differentiate (D, I). The average percentage of centromeres associated with nucleoli reduces significantly as cells differentiate (E, J). In comparison, the percentage of centromeres associating with the nuclear periphery is increased (F, K). Box plots indicate 25th–75th percentile values, with whiskers indicating minimum and maximum observed values. Scatter plots indicate the value of individual cellular measurements, with the horizontal line indicating the mean. Statistical significance was computed as two-tailed t tests of means with unequal variance. Bar = 5 μm. n > 50 per cell type. *: p < 0.05; ****: p < 0.0001.

