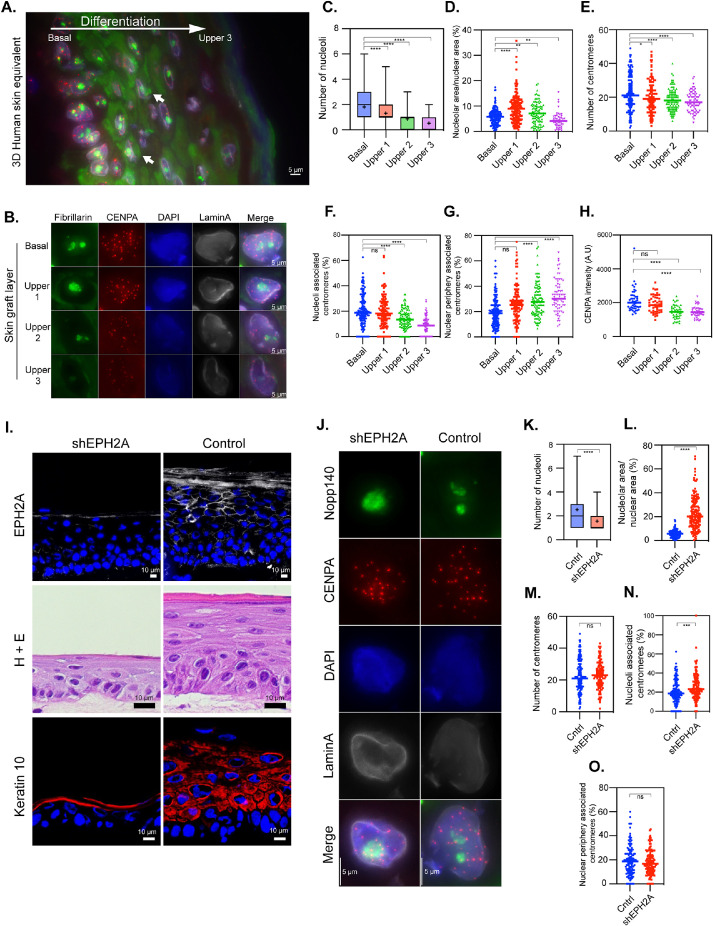
FIGURE 3:
Nucleolus–centromere interactions decrease as keratinocytes differentiate from basal cells toward cornified layers. Nucleoli are immunolabeled with anti-fibrillarin antibody (green), centromeres by anti-CENPA (red) antibodies, and nuclear lamin by anti-lamin A (grayscale) antibodies. (A) A cross-section of a three-dimensional (3D) human skin equivalent containing all layers in the same image demonstrates the clear changes in centromere numbers and intensity of the signals as well as their association with nucleoli as they develop into cornified layers. The large white arrow indicates the direction of differentiation, and small white arrows indicate examples of extranuclear fibrillarin staining. (B) Typical results of stains in cells from layers ranging from basal to upper layers are as shown. The number of nucleoli (C) and nucleolar area (D) decrease in parallel with the differentiation. Countable centromeres (E) and the percentage of centromeres associated with nucleoli (F) also reduces as cells differentiate. Correspondingly, the percentage of centromeres associating with nuclear periphery is increased (G). (H) CENPA fluorescent intensity is reduced progressively as cells differentiate. (I) Immunolabeling and a hematoxylin and eosin (H+E) staining demonstrate that transduction of a short hairpin construct targeting EPH2A (shEPH2A) reduces EPH2A expression (top row) and impairs differentiation in a 3D human skin equivalent compared with cells transduced with a construct with a scrambled sequence and no target (control). (J) Representative stains of transduced basal layer keratinocytes demonstrate a lower number of nucleoli (K), an increase in nucleolar area relative to nuclear area (L), no difference in centromere number (M), an increase in overlap between centromeres and nucleoli (N), and no difference in centromere overlap with the nuclear periphery (O). Box plots indicate the 25th–75th percentile values, with the whiskers indicating minimum and maximum observed values. Scatter plots indicate the value of individual cellular measurements, with the horizontal line indicating the mean. Statistical significance was computed as two-tailed t tests of means with unequal variance. n ranges from 72 to 154 per cell type (top) and >130 per condition (bottom). Bar = 5 μm. A.U. = arbitrary units; ns: not significant; *: p < 0.05; **: p < 0.01; ***: p < 0.001; ****: p < 0.0001.

