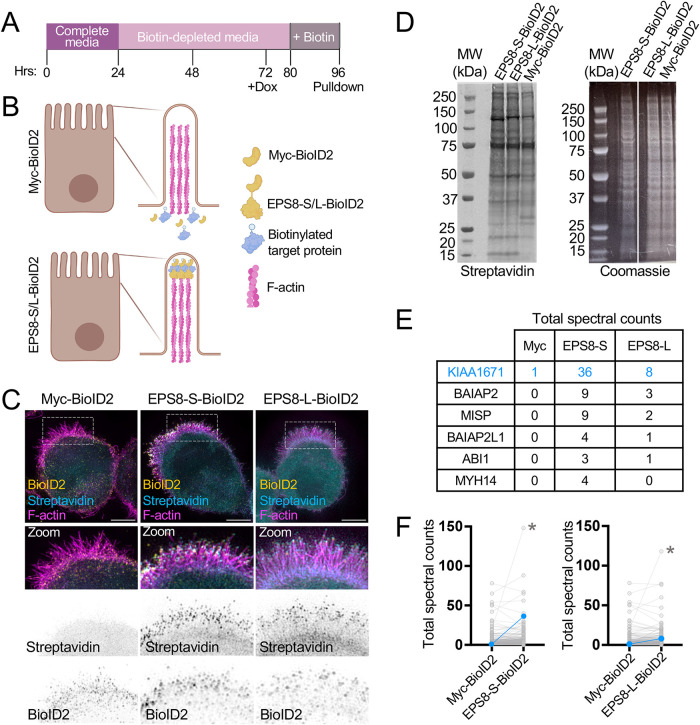
FIGURE 1:
Utilizing biotin proximity labeling to probe for molecules involved in microvilli biogenesis. (A) Schematic timeline of W4 induction and biotin supplementation before streptavidin pull down. (B) Schematic representation of a W4 cell expressing the myc-BioID2 construct and EPS8-S/L-BioID2 constructs. Upon addition of 50 µM biotin to cell culture medium overnight, the BioID2 construct will promiscuously biotinylate proteins within an ∼10–25 nm radius. (C) Representative cells expressing either the myc-BioID2 control, EPS8-BioID2-HA, or EPS8-13xL-BioID2-HA constructs (yellow) and stained with streptavin-488 (cyan) and phalloidin (magenta) to determine the extent of biotinylation in the brush border of W4 cells. (D) Biotinylated proteins from EPS8-S-BioID2-HA, EPS8-L-BioID2-HA, or myc-BioID2 samples separated by SDS page and detected with a fluorescent streptavidin conjugate (left). Coomassie staining of previously stated samples to confirm equal total protein input for pulldown (right). (E) Highlighted raw total spectra counts of known EPS8 interacting proteins or brush border resident proteins detected in myc-BioID2, EPS8-S-BioID2, and EPS8-L-BioID2 samples. (F) Plots comparing total spectral counts between proteins detected in myc-BioID2 vs. EPS8-s-BioID2 or EPS8-L-BioID2 samples. Connected blue data points indicate KIAA1671 spectral counts, and asterisks indicate spectral counts of EPS8-S/L-BioID2 protein in samples.

