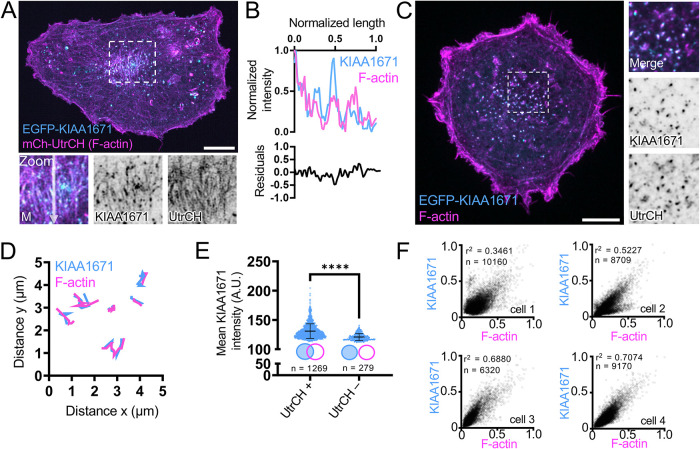
FIGURE 3:
KIAA1671 overlaps with dynamic actin-rich structures in unpolarized cells. (A) A representative B16F1 cell expressing EGFP-KIAA1671 and mCherry-UtrCH to mark F-actin. Zooms highlight linear actin features. Scale bar = 10 µm. (B) Linescan of linear features as highlighted in A, zoom. (C) B16F1 cell displaying cytoplasmic puncta of EGFP-KIAA1671 and mCherry-UtrCH. Scale bar = 10 µm. (D) Representative trajectory analysis of 6 EGFP-KIAA1671 and mCherry-UtrCH puncta as represented in C. Traces measured at 5-s intervals sampled over a 45-s time period from a single imaging field. (E) 2D puncta analysis comparing mean EGFP-KIAA1671 intensities of puncta either associated (UtrCH +) or not associated (UtrCH-) with UtrCH puncta. Plots are representative from a single cell over a 15-min imaging window. **** p < 0.0001 using a two-tailed Mann–Whitney test, n = 1269 UtrCH + puncta; n = 279 UtrCH – puncta. Plots show mean ± SD. (F) Two-dimensional intensity correlations of EGFP-KIAA1671 puncta with mCherry-UtrCH from six cells over two independent experiments. p values were calculated from a two-tailed test. All images are displayed as maximum intensity projections.

