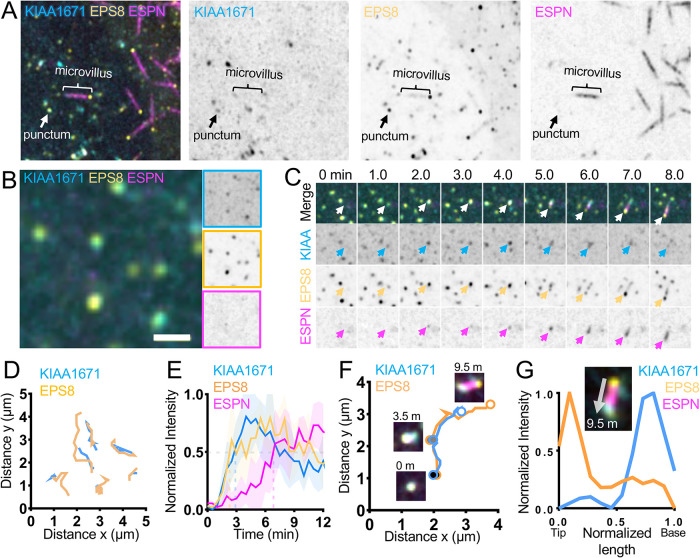
FIGURE 4:
KIAA1671 and EPS8 puncta associate and then separate during microvillus growth. (A) CL4 cell displaying microvilli as well as cytoplasmic KIAA1671 and EPS8 puncta in cells expressing Halo-KIAA1671, EGFP-EPS8, and mCherry-ESPN. Box width = 15 µm. (B) Representative image of EGFP-EPS8 and Halo-KIAA1671 puncta in CL4 cells. Single-channel images are denoted by border outline in corresponding color (right). (C) Montage of a de novo microvillus growth event in a CL4 cell expressing EGFP-KIAA1671 (KIAA, cyan), EGFP-EPS8 (yellow), and mCherry-ESPN (magenta). Box width = 4 µm. (D) Trajectory analysis of Halo-KIAA1671 and EGFP-EPS8 puncta as represented in B. Traces are measured at 30-s intervals sampled from a 30-min time period from a single imaging field. (E) Averaged normalized intensity vs. time curves representing 5 de novo microvillus growth events from the imaging experiment shown in C. Solid line represents mean and shaded area represents SD. (F) Trajectory analysis of Halo-KIAA1671 (cyan) and EGFP-EPS8 (yellow) during a de novo microvillus growth event. Large, shaded circles represent indicated time points during the trajectory. (G) Image of the 9.5-min time point indicated in F (Top) with linescan demonstrating separation of the Halo-KIAA1671 and EGFP-EPS8 signals to opposite ends of the microvillus. All images are displayed as maximum-intensity projections.

