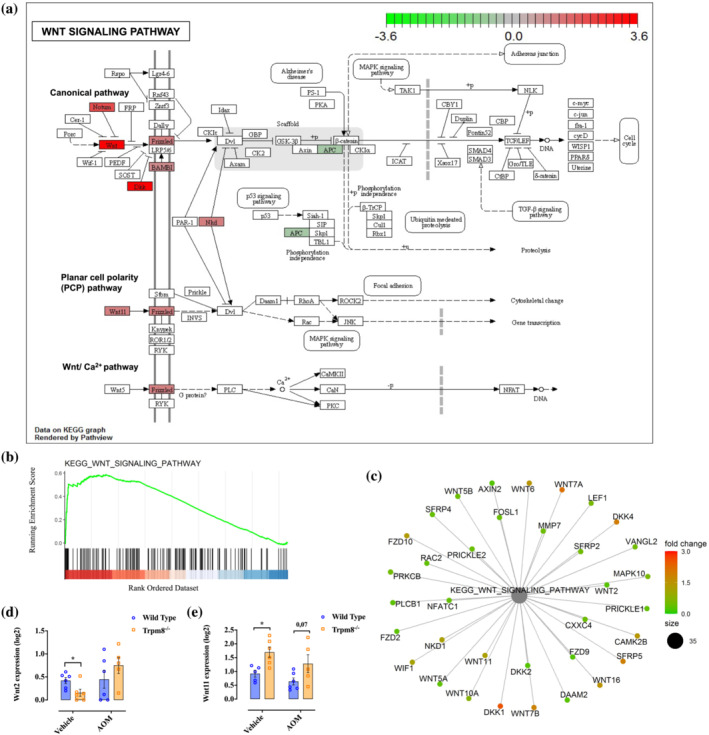
FIGURE 4.

Kyoto Encyclopedia of Genes and Genomes (KEGG) Wnt signalling pathway. (a) Overlay of the differentially expressed genes (DEGs) between high and low Trpm8 expression groups on the KEGG pathway. The overexpressed and underexpressed genes are represented in red and green, respectively. (b) Gene set enrichment analysis (GSEA) enrichment plot. In green, the enrichment profile; in black on the X‐axis, the hits. Colour scale on the X‐axis goes from high (red) to low (blue) expression of genes in the high Trpm8 group. (c) Cnetplot showing the linkages between genes and biological concepts. The overexpressed and underexpressed genes are represented in red and green, respectively. (d, e) Expression of Wnt2 (d) and Wnt11 (e) by RNA sequencing analysis on the colon of wild‐type (blue) and Trpm8 −/− (orange) mice, treated with vehicle or azoxymethane (AOM) (n = 6 mice). P values were determined using multiple Student's t test. *P < 0.05 wild‐type vehicle versus Trpm8 −/− vehicle.
