
FIGURE 5.
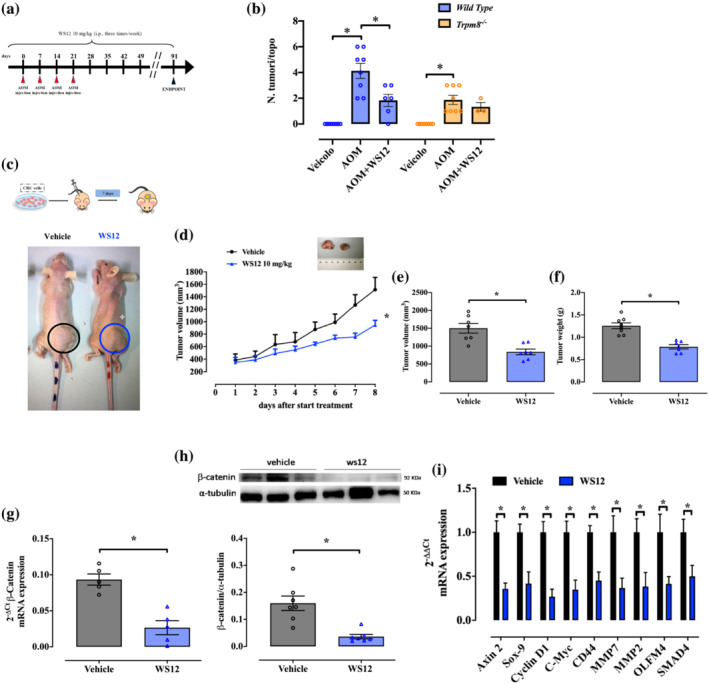
Pharmacological modulation of Trpm8 reduces tumour growth in azoxymethane (AOM) and xenograft models of colon cancer by impairing the Wnt/β‐catenin pathway. (a) Schematic representation of the AOM protocol and timeline. Mice were injected with 10 mg·kg−1 of AOM at the indicated time. WS12 (10 mg·kg−1) was administered intraperitoneally every other day. (b) Number of tumours per mouse counted on wild‐type (blue) and Trpm8 −/− (orange) mouse colon, treated with vehicle (n = 8 mice), AOM (n = 8 mice) or AOM + WS12 (n = 6 wild‐type mice and n = 3 Trpm8 −/− mice, three dead mice values were excluded, and this experimental group was not subjected to statistical analysis). P values were determined using two‐way ANOVA followed by Tukey's multiple comparisons test. *P < 0.05 Trpm8 −/− AOM versus vehicle, *P < 0.05 wild‐type AOM + WS12 versus AOM and *P < 0.05 wild‐type AOM versus vehicle. (c) Upper panel: Schematic representation of the xenograft protocol. WS12 (10 mg·kg−1) was administered intraperitoneally every day. Lower panel: Pictures of athymic mice bearing xenograft tumours on the day of killing. Tumors are indicated with black (vehicle) and blue (WS12) circles (d) Analysis of tumour volume of mice receiving vehicle (black) or WS12 (blue) in an 8‐day time course. Tumour size was measured every day and the volume was calculated. Each dot represents the mean ± SEM of seven mice. P values were determined using the Tukey–Kramer test; *P < 0.05 versus vehicle. (e, f) Analysis of tumour volume (e) and weight (f) of the explanted tumours from mice treated with vehicle (black) or WS12 (blue), at the end of the experiment (n = 7). P values were determined using unpaired Student's t tests; *P < 0.05 versus vehicle. (g) β‐Catenin mRNA expression was evaluated by reverse transcription quantitative polymerase chain reaction (RT–qPCR) and calculated by using the 2−ΔΔCt formula in xenografted tumours explanted from mice treated with vehicle (black) or WS12 (blue) (n = 5 different biological samples). P values were determined using unpaired Student's t tests; *P < 0.05 versus vehicle. (h) Representative immunoblots of β‐catenin protein levels in xenografted tumours explanted from mice receiving vehicle (black) or WS12 (blue). Lower panel shows densitometric analysis of western blot analysis. Results show mean ± SEM of seven different biological samples for each experimental group (i.e., vehicle and WS12) (n = 1 outlier has been removed from WS12 group with ROUT test). P values were determined using unpaired Student's t tests; *P < 0.05 versus vehicle. (i) Wnt signalling pathway‐associated genes (Axin 2 [axis inhibition protein 2], Sox‐9 [SRY‐box transcription factor 9], Cyclin D1, C‐Myc, CD44, MMP7 [matrix metalloproteinase 7], MMP2 [matrix metalloproteinase 2], OLFM4 [olfactomedin protein 4] and SMAD4) mRNA expression was evaluated by RT–qPCR and calculated by using the 2−ΔΔCt formula in xenografted tumours explanted from mice treated with vehicle (black) or WS12 (blue) (n = 5 different biological samples). P values were determined using multiple Student's t tests; *P < 0.05 versus vehicle.